The Importance of Google Analytics: The Good, The Bad and What You’re Missing
Feb 27, 2025
Published by: Lucky Orange

Do you know why your website visitors aren’t converting? It’s a game-changing question for anyone managing a website, especially if you’re relying solely on Google Analytics to guide your optimization efforts.
Here’s the thing: Google Analytics (GA4) only provides part of the story. While it’s a valuable tool for data collection, too many businesses assume it provides the full picture of their website’s performance. In today’s competitive digital landscape, understanding your visitors requires deeper insights—beyond what GA4 can offer alone.
The Good: Why Google Analytics is a Must-Have
Google Analytics was launched in 2005 following Google’s acquisition of Urchin and it quickly became a game-changer. Fast forward to 2024 and more than 44 million websites have utilized Google Analytics, cementing its position as the world’s leading analytics tool.
The platform has evolved alongside the digital landscape. In 2023, Google retired Universal Analytics and introduced Google Analytics 4 (GA4), a next-generation tool designed for the modern web.
With advanced tracking and reporting features, the benefits of Google Analytics are undeniable. GA4 empowers businesses to gain deeper insights and make smarter decisions.
Google Analytics Data: Quantitative Metrics That Matter
When it comes to website data points, chances are Google Analytics has you covered.
From website traffic channels and session data to conversion goals and more, Google Analytics is a one-stop metric shop for website analytics across industry and vectors:
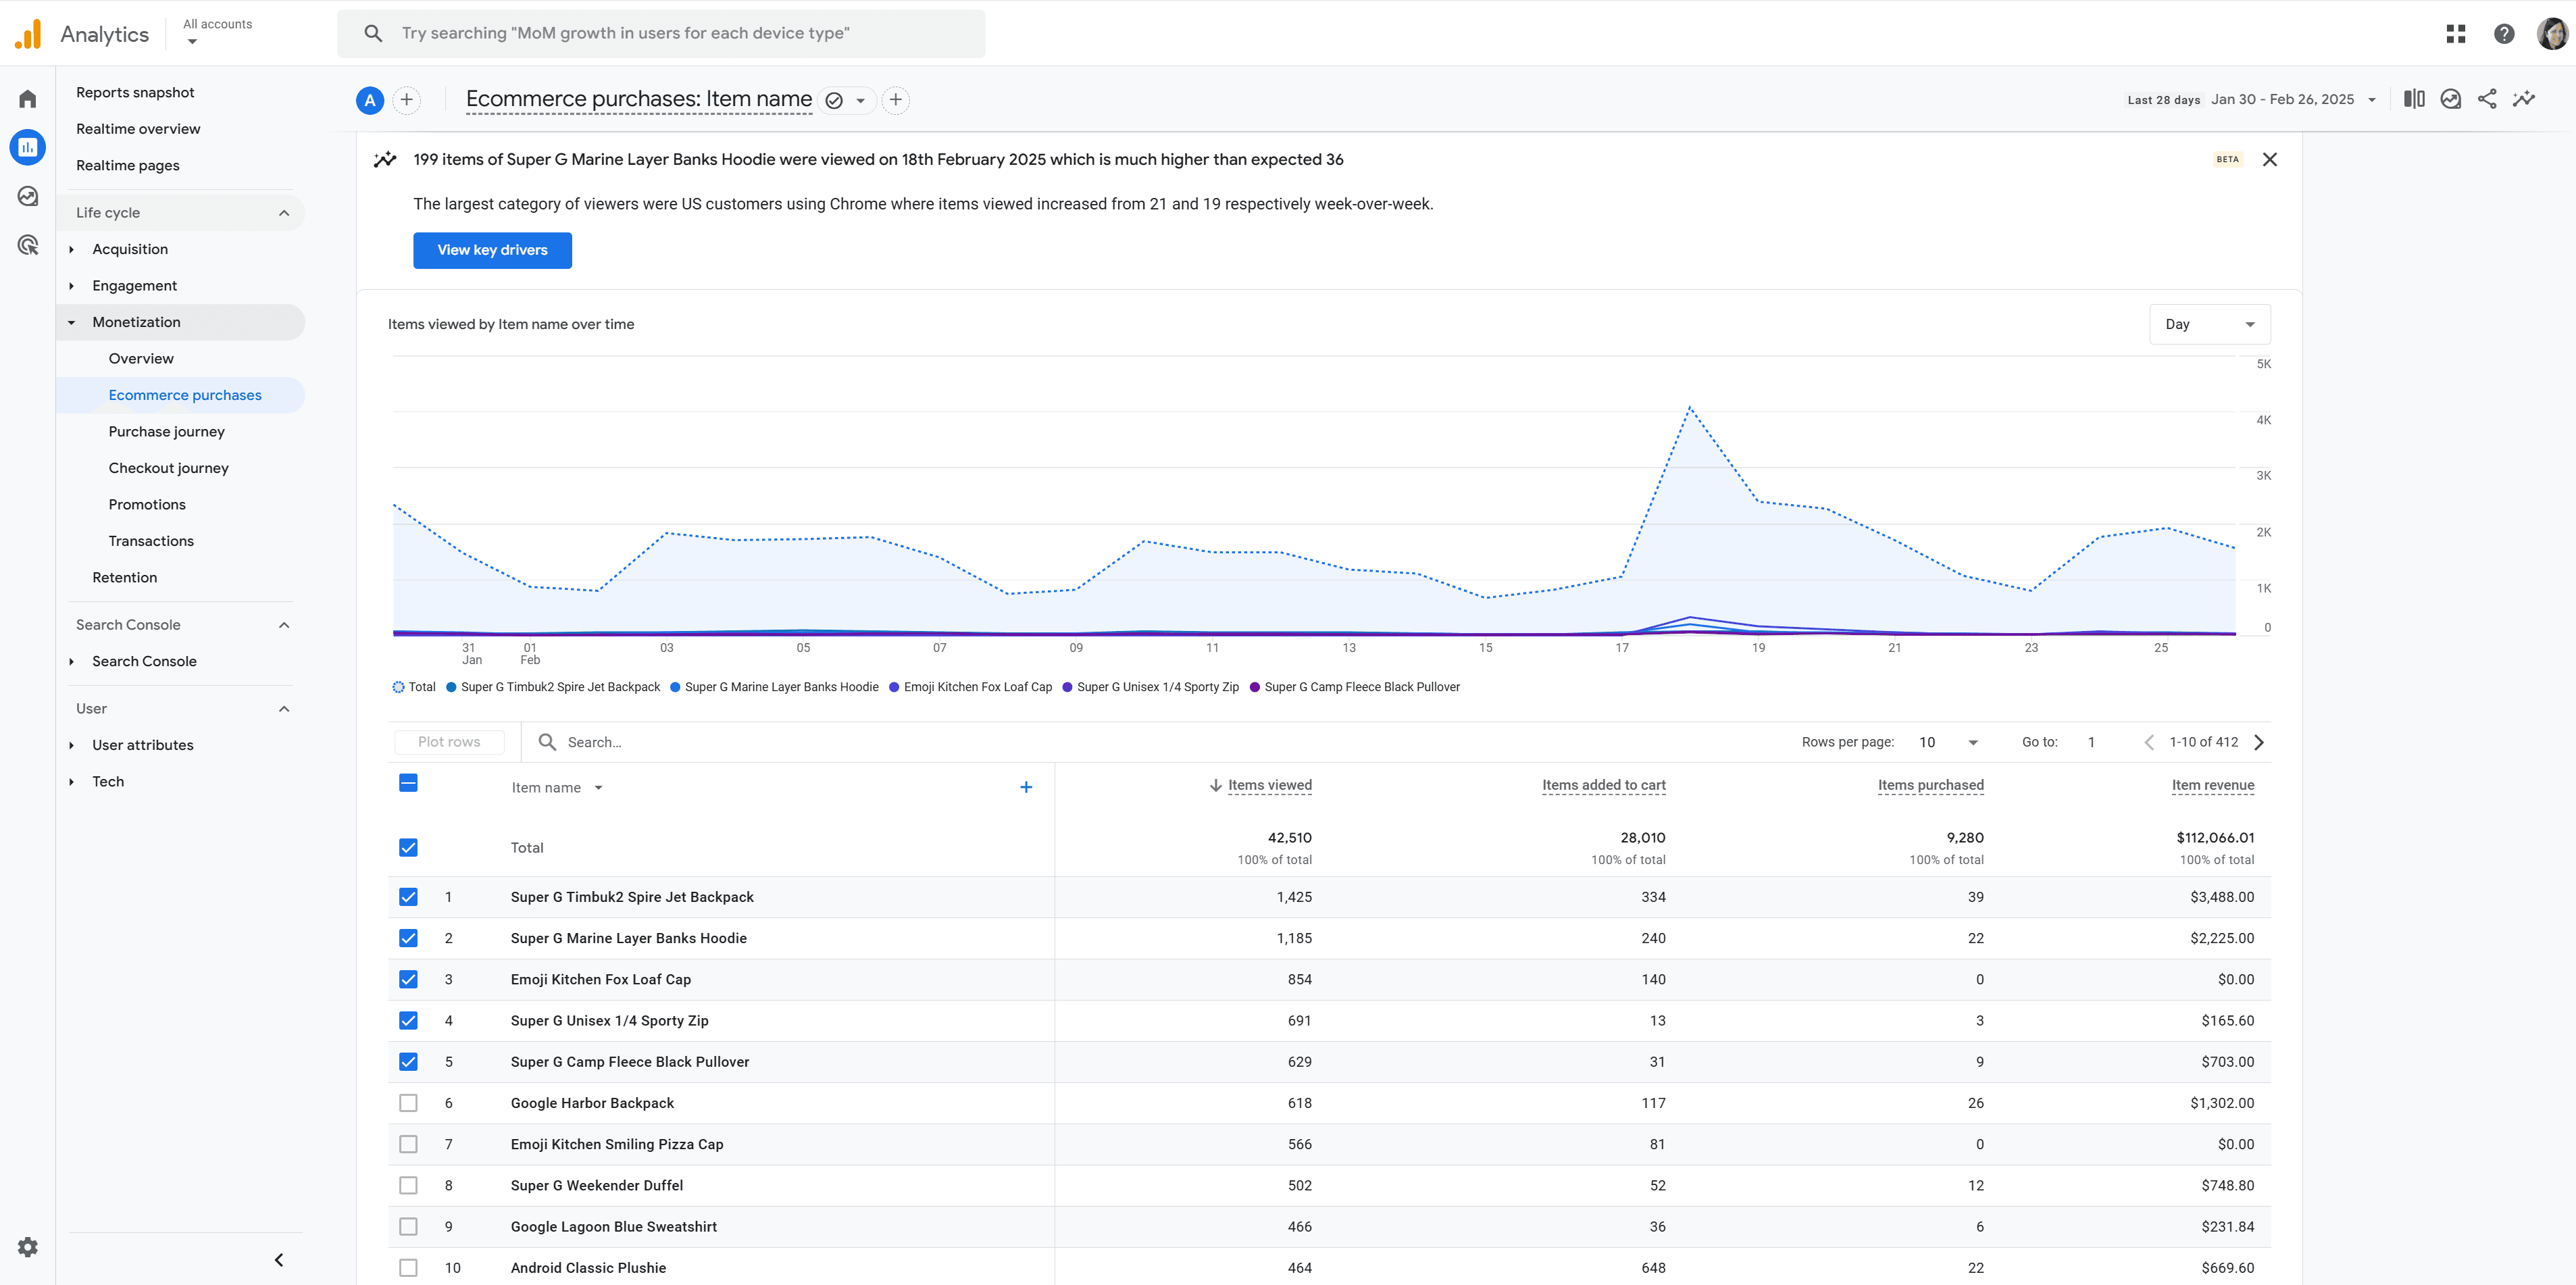
E-commerce
Identify top-performing products to boost profitability
Measure cart abandonment rates to reduce lost sales
Education
Measure application submissions to improve your outreach strategy
Track enrollment trends and optimize recruitment efforts
SaaS
Analyze subscription usage to improve user retention
Evaluate churn rates to uncover growth opportunities
B2B
Track account-level data for better client targeting
Assess lead source performance to refine marketing strategies
Agencies
Monitor client acquisition events to guide your campaigns
Evaluate campaign performance to showcase ROI
New to GA4? If you want to get started with the benefits of Google Analytics, check out Moz Pro’s beginner’s guide. It’s packed with easy-to-follow tips to help you answer key questions, like who’s visiting your site and what drives the most traffic.
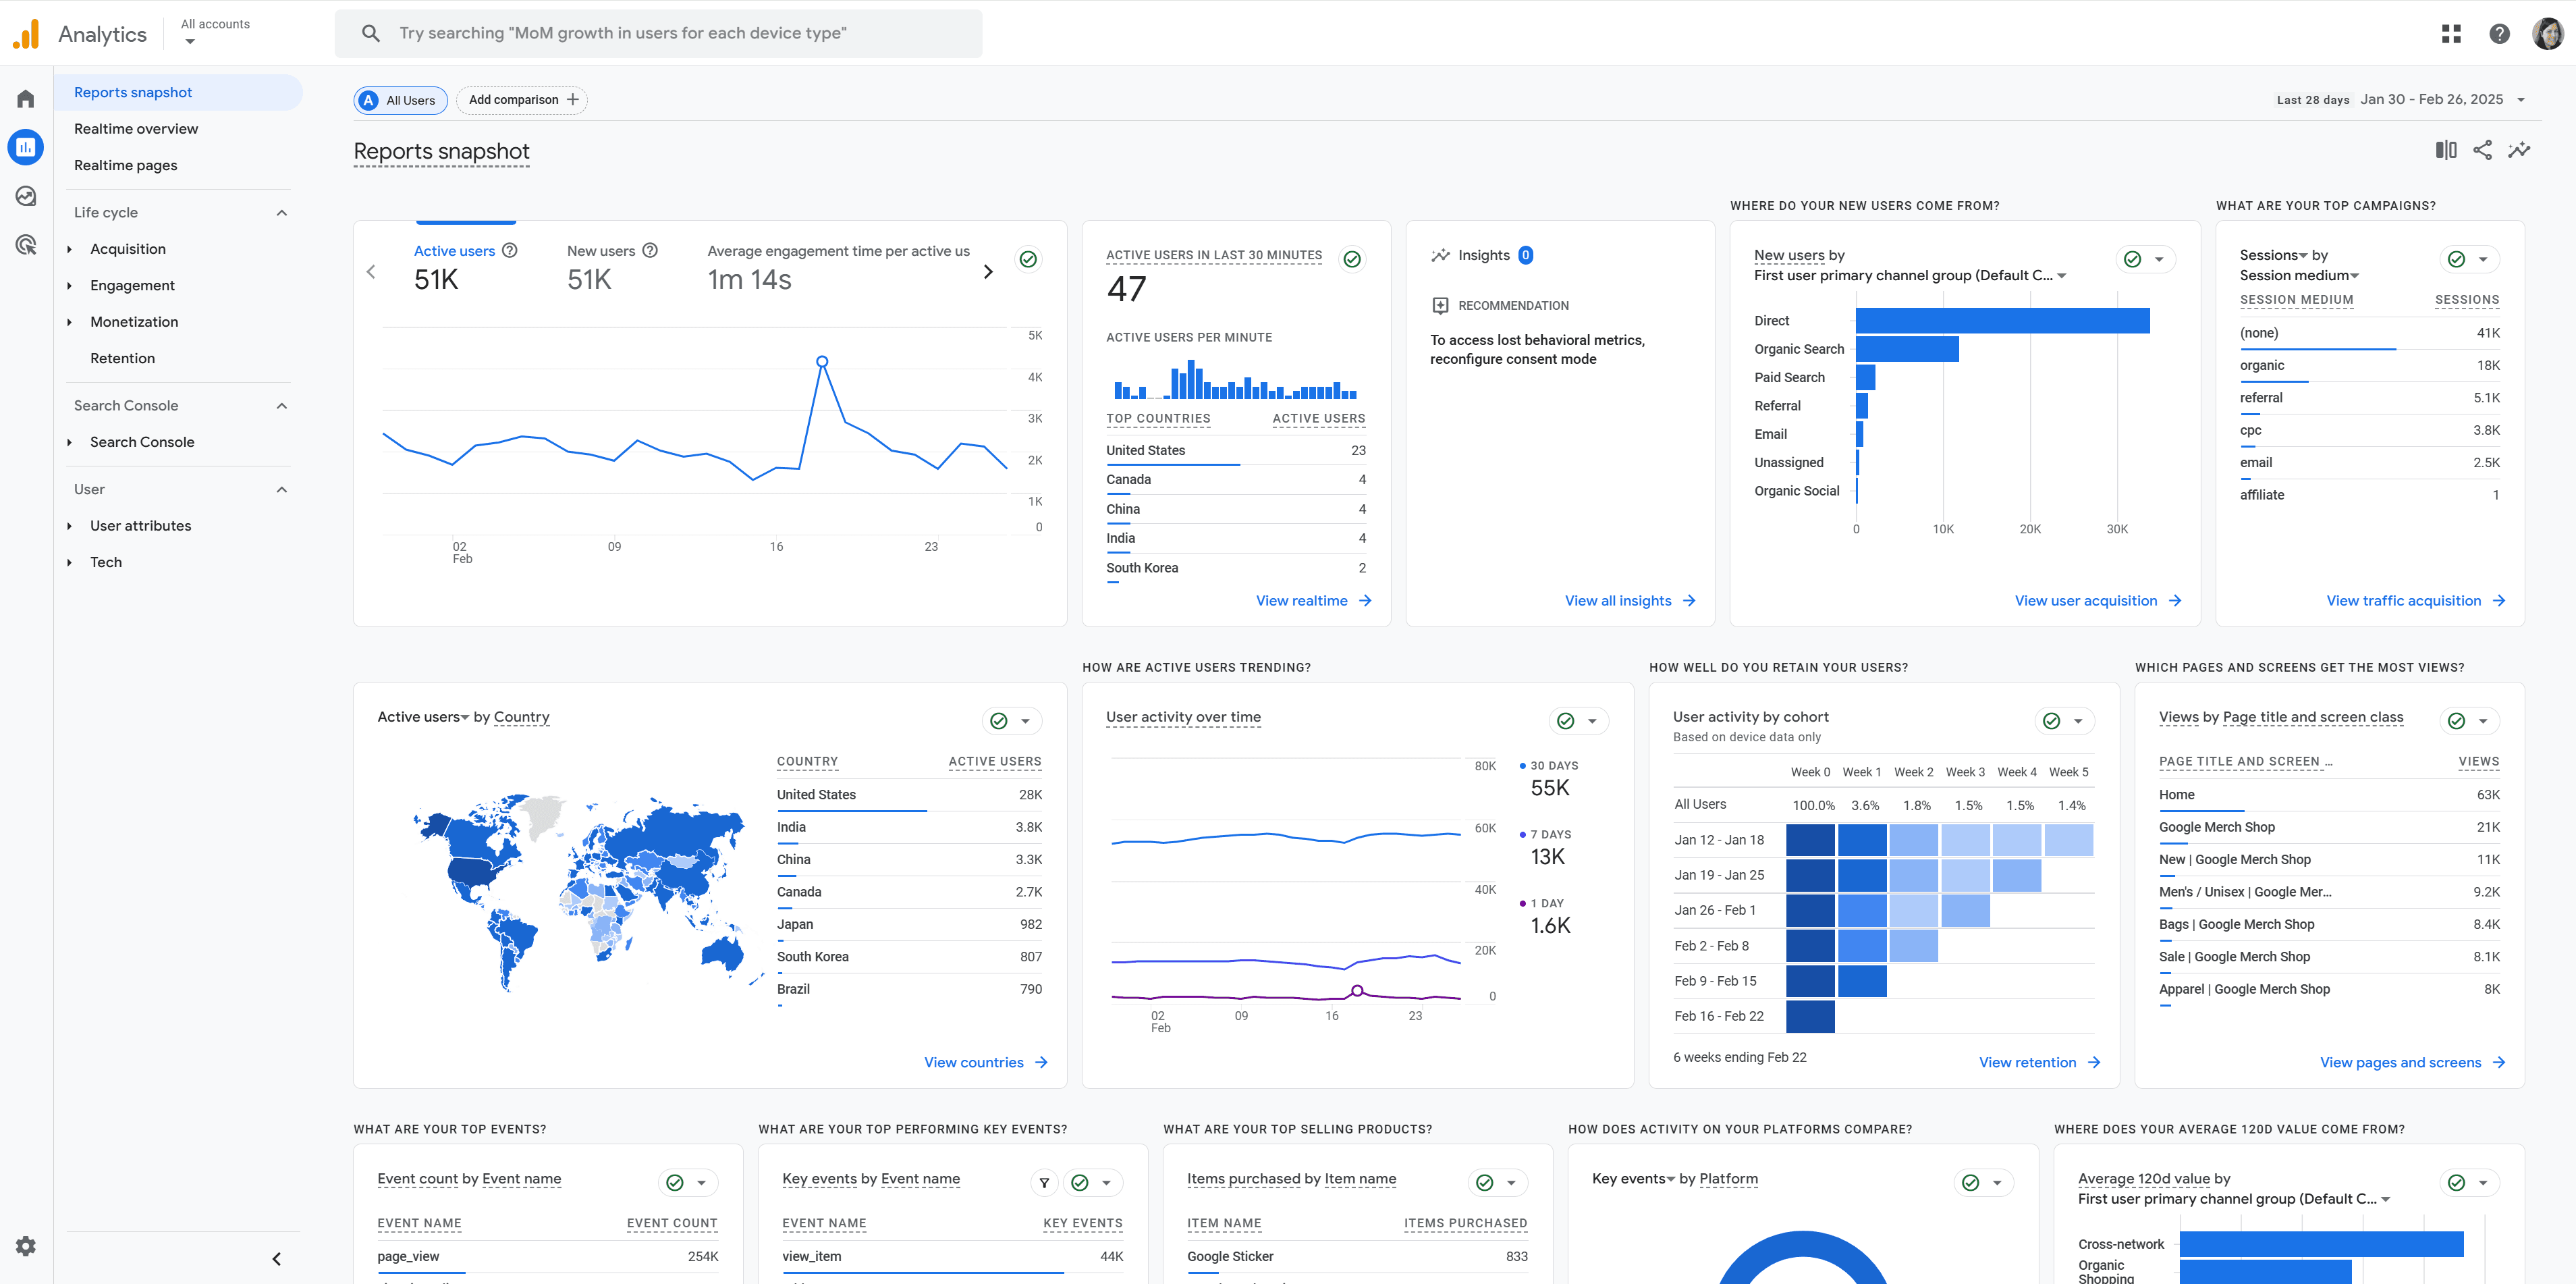
Leveraging AI & Advanced Report Creation in GA4
The benefits of Google Analytics don't stop there. GA4 is transforming the way businesses analyze data by incorporating advanced AI and reporting tools to deliver deeper insights and drive smarter decision-making.
Unlock the Power of AI in GA4
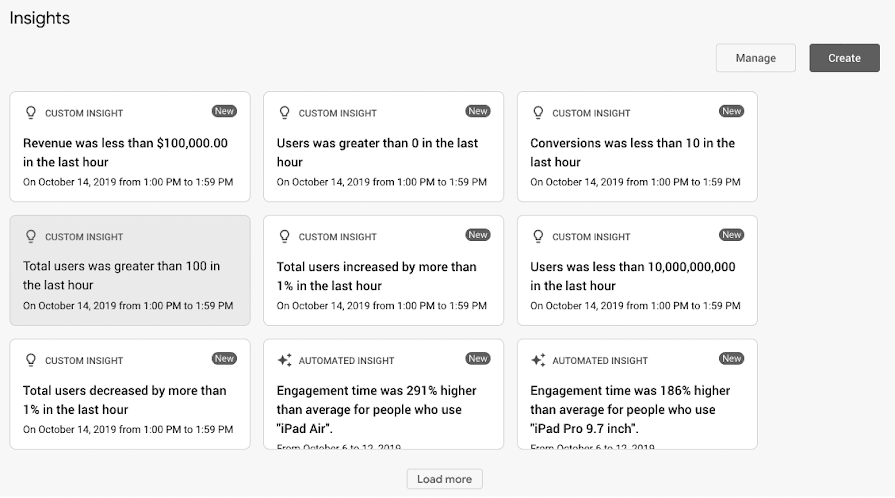
With GA4’s innovative Insights feature available on the Analytics home page, you can leverage the power of machine learning to uncover trends, make forecasts and simplify analysis, such as forecasting website traffic from organic Google searches and compare it to actual results.
You can also create your own custom Insights or focus on advertising-specific insights to fine-tune your strategy.
Create Custom Reports (GA4 Explorations)
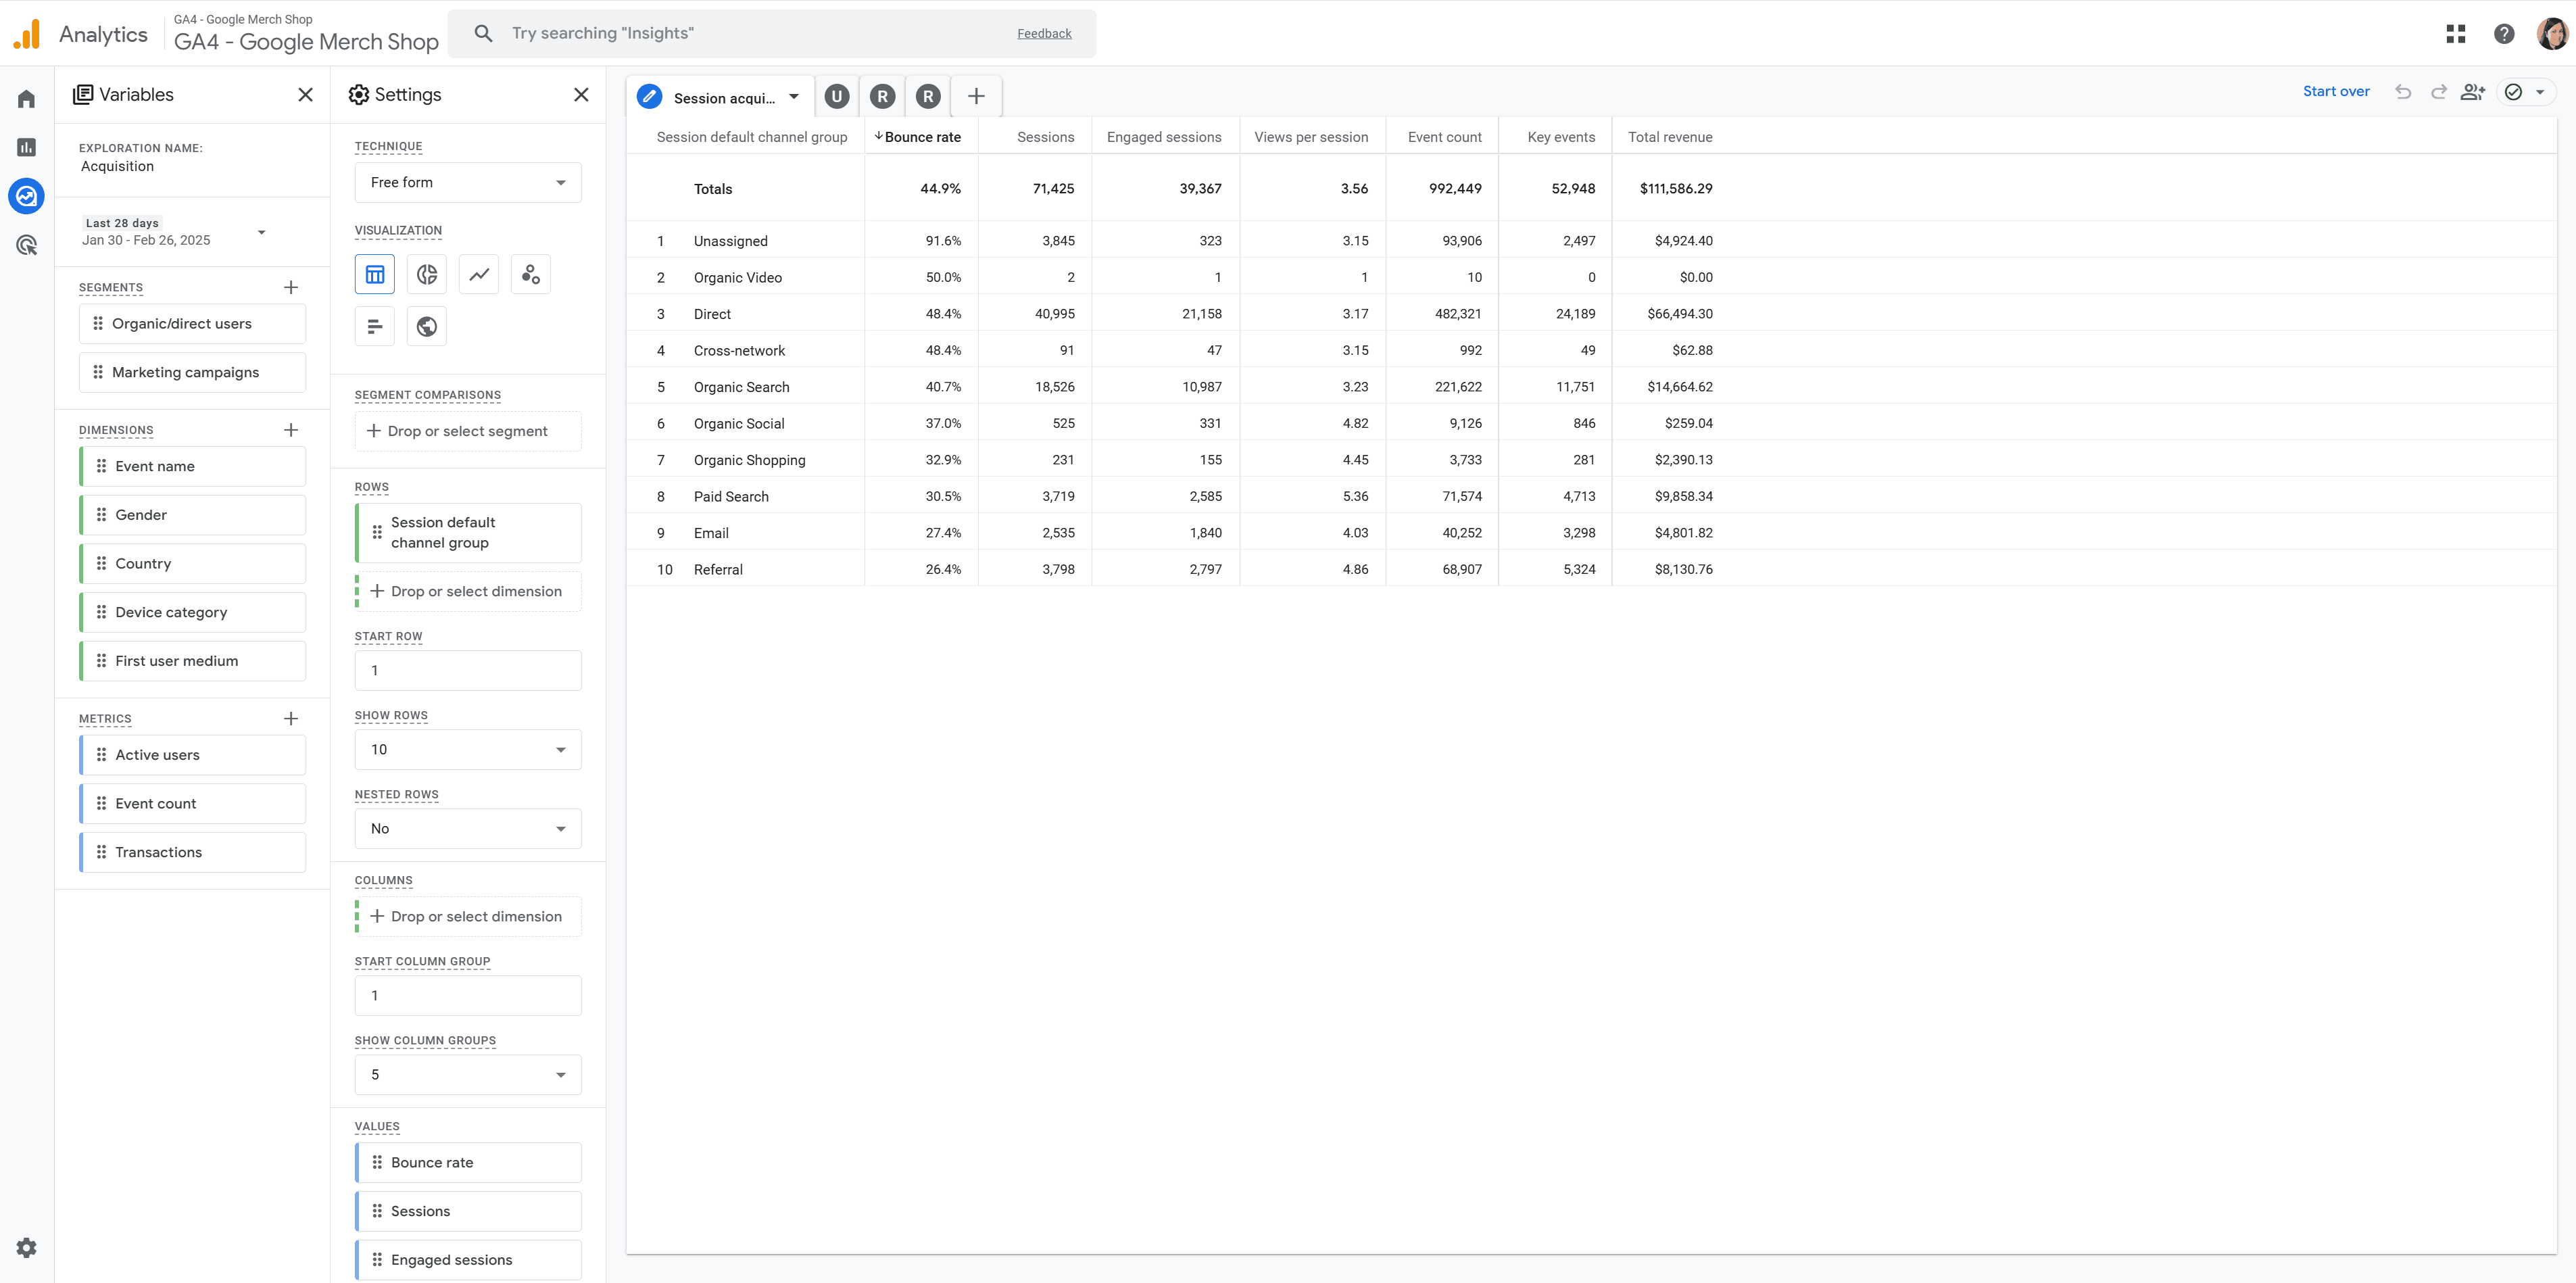
Under Explorations you can create tailored reports that align with your business goals. By customizing dimensions, metrics and filters, you’ll gain valuable insights into user behavior data and user acquisition data, helping you understand both how users interact with your site and how they arrive there.
Choose from six premade exploration templates or build your own for use cases like acquisition, key events, user behavior and even predicting top spenders. Here are our favorite reports:
Traffic Acquisition: Curious if your search engine optimization (SEO) strategy or PPC campaign is paying off? With this report, you’ll get a detailed breakdown of traffic and referral sources, helping you identify what’s working and where to optimize.
Content Efficiency: For those familiar with Google Analytics, this report tracks key metrics like entrances, page views, bounces and goal completions. It’s ideal for understanding how well your content performs. Learn more from Avinash Kaushik, author of “Web Analytics 2.0,” to get started.
Landing Pages: Want to see which pages are drawing visitors in? This report highlights landing page performance and pinpoints pages with high bounce rates. Use these insights to make these pages more engaging and effective.
Combining Google Analytics with Other Google Products
The benefits of the tool integrate seamlessly into other Google products as well. The benefits of the tool integrate seamlessly into other Google products, enhancing the value of Google Analytics data.
GA4 + Google Ads
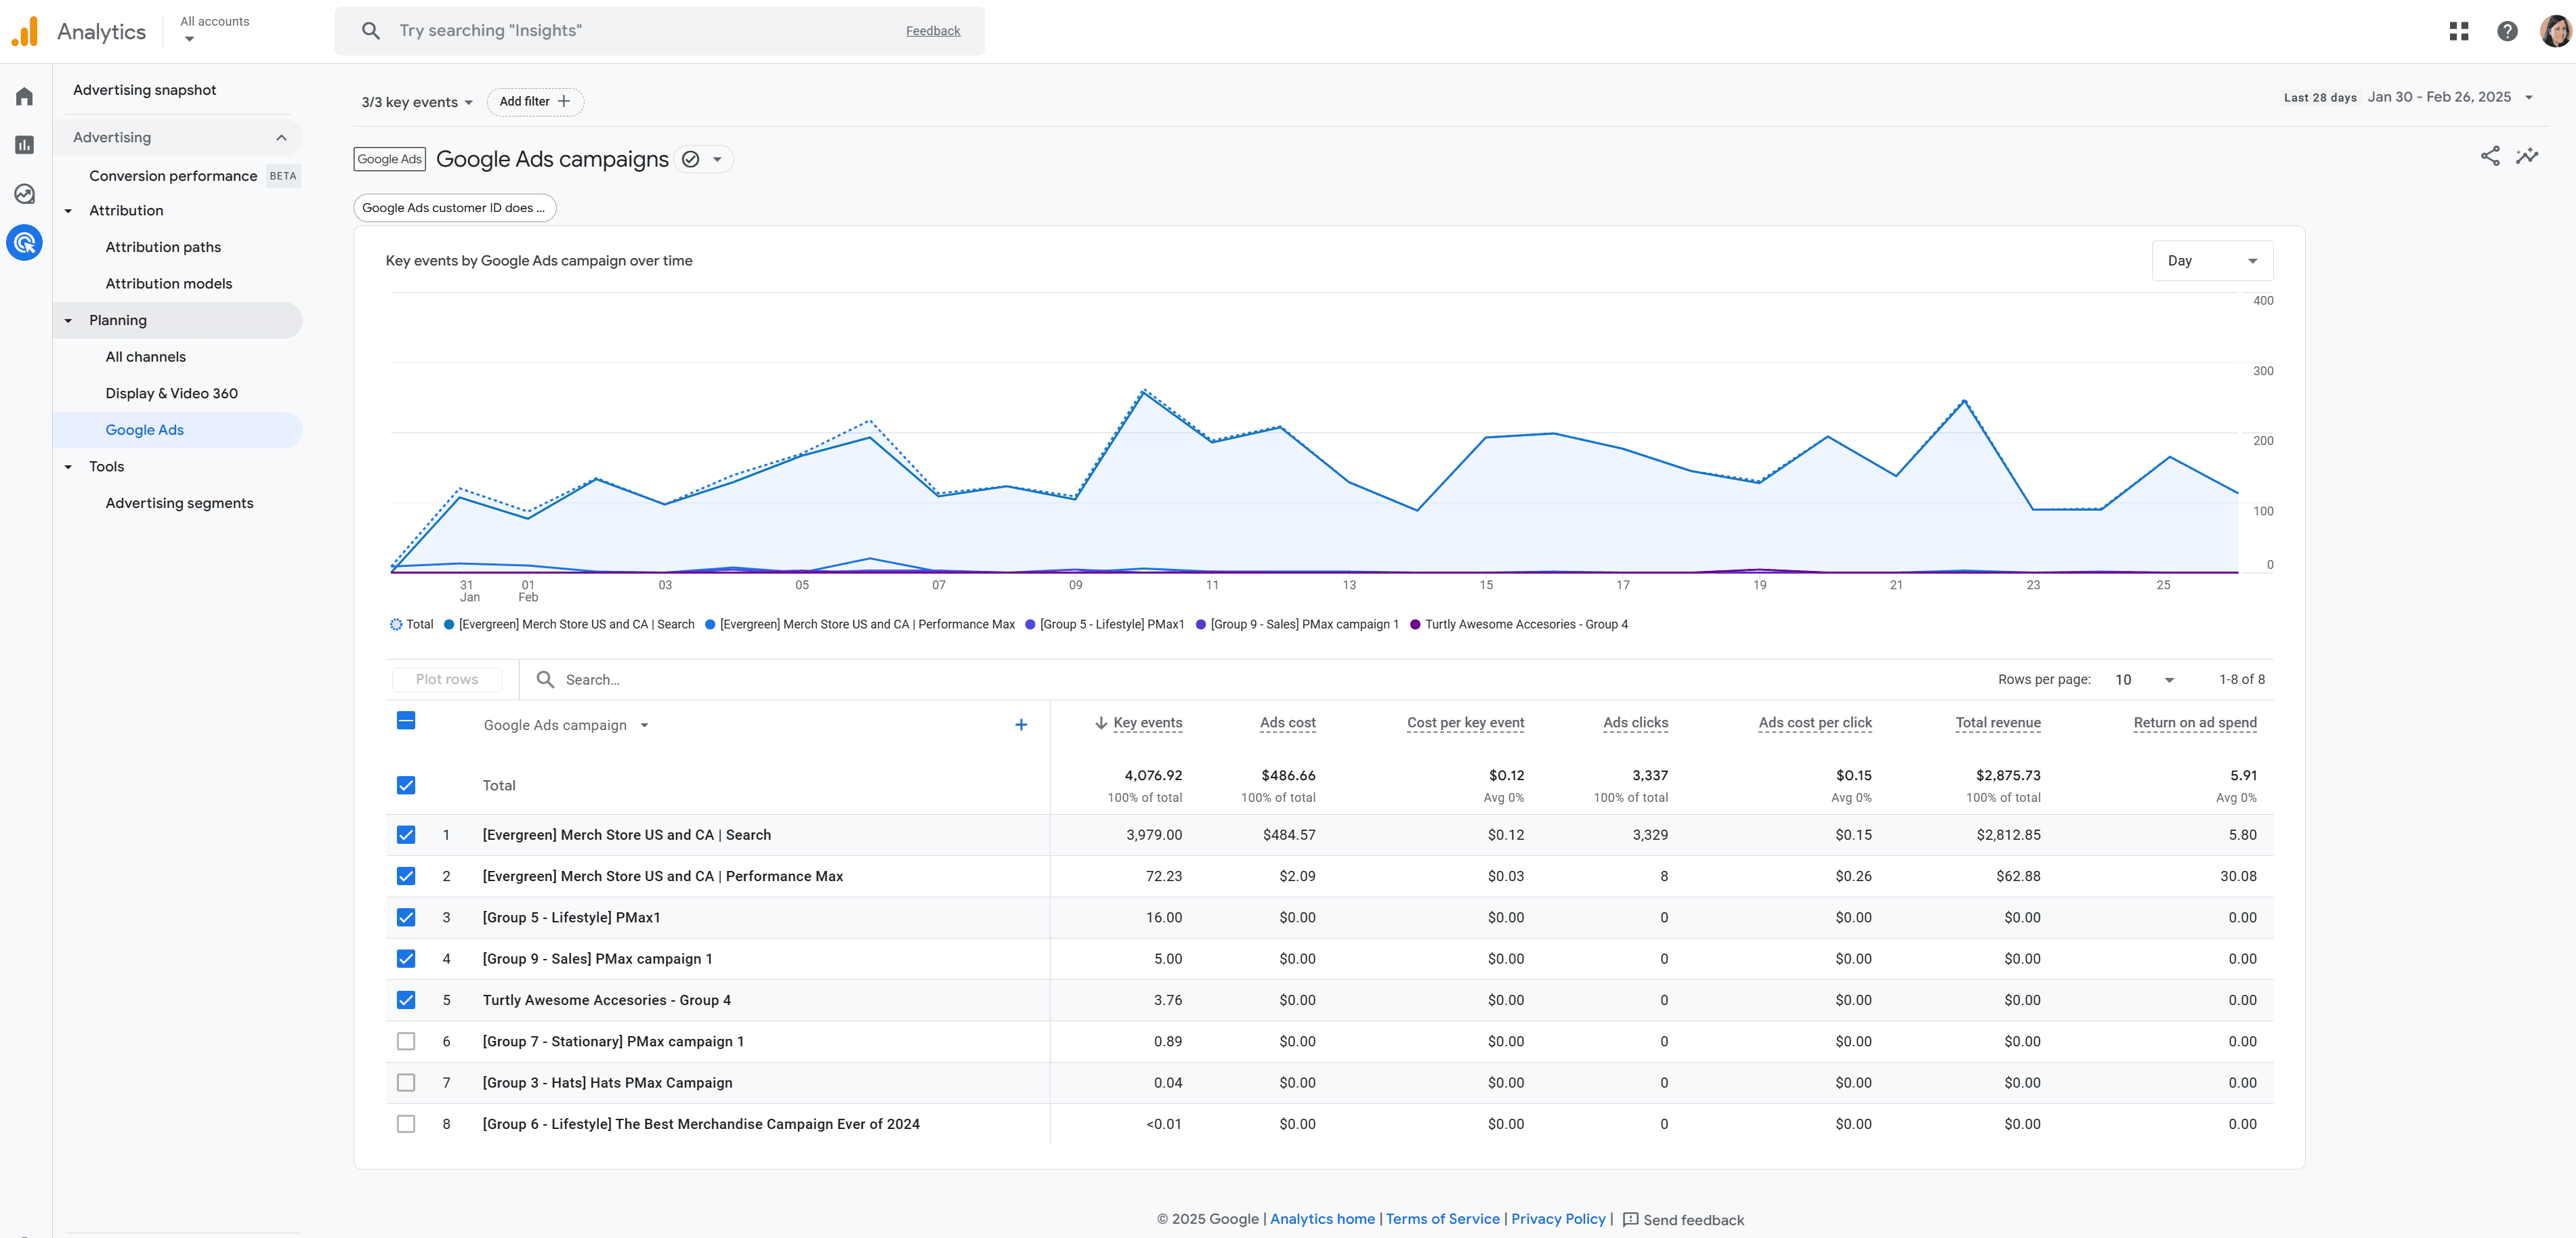
If you're running paid campaigns on Google Ads, linking them to your GA4 account is a smart move.
GA4 unlocks powerful tools to take your campaigns to the next level by helping you make data-driven decisions by doing things like measuring conversion rates on your terms, such as defining it by specific actions or products and using GA4's conversion data with Google's Smart Bidding algorithm for smarter ad strategies.
GA4 + Google Search Console
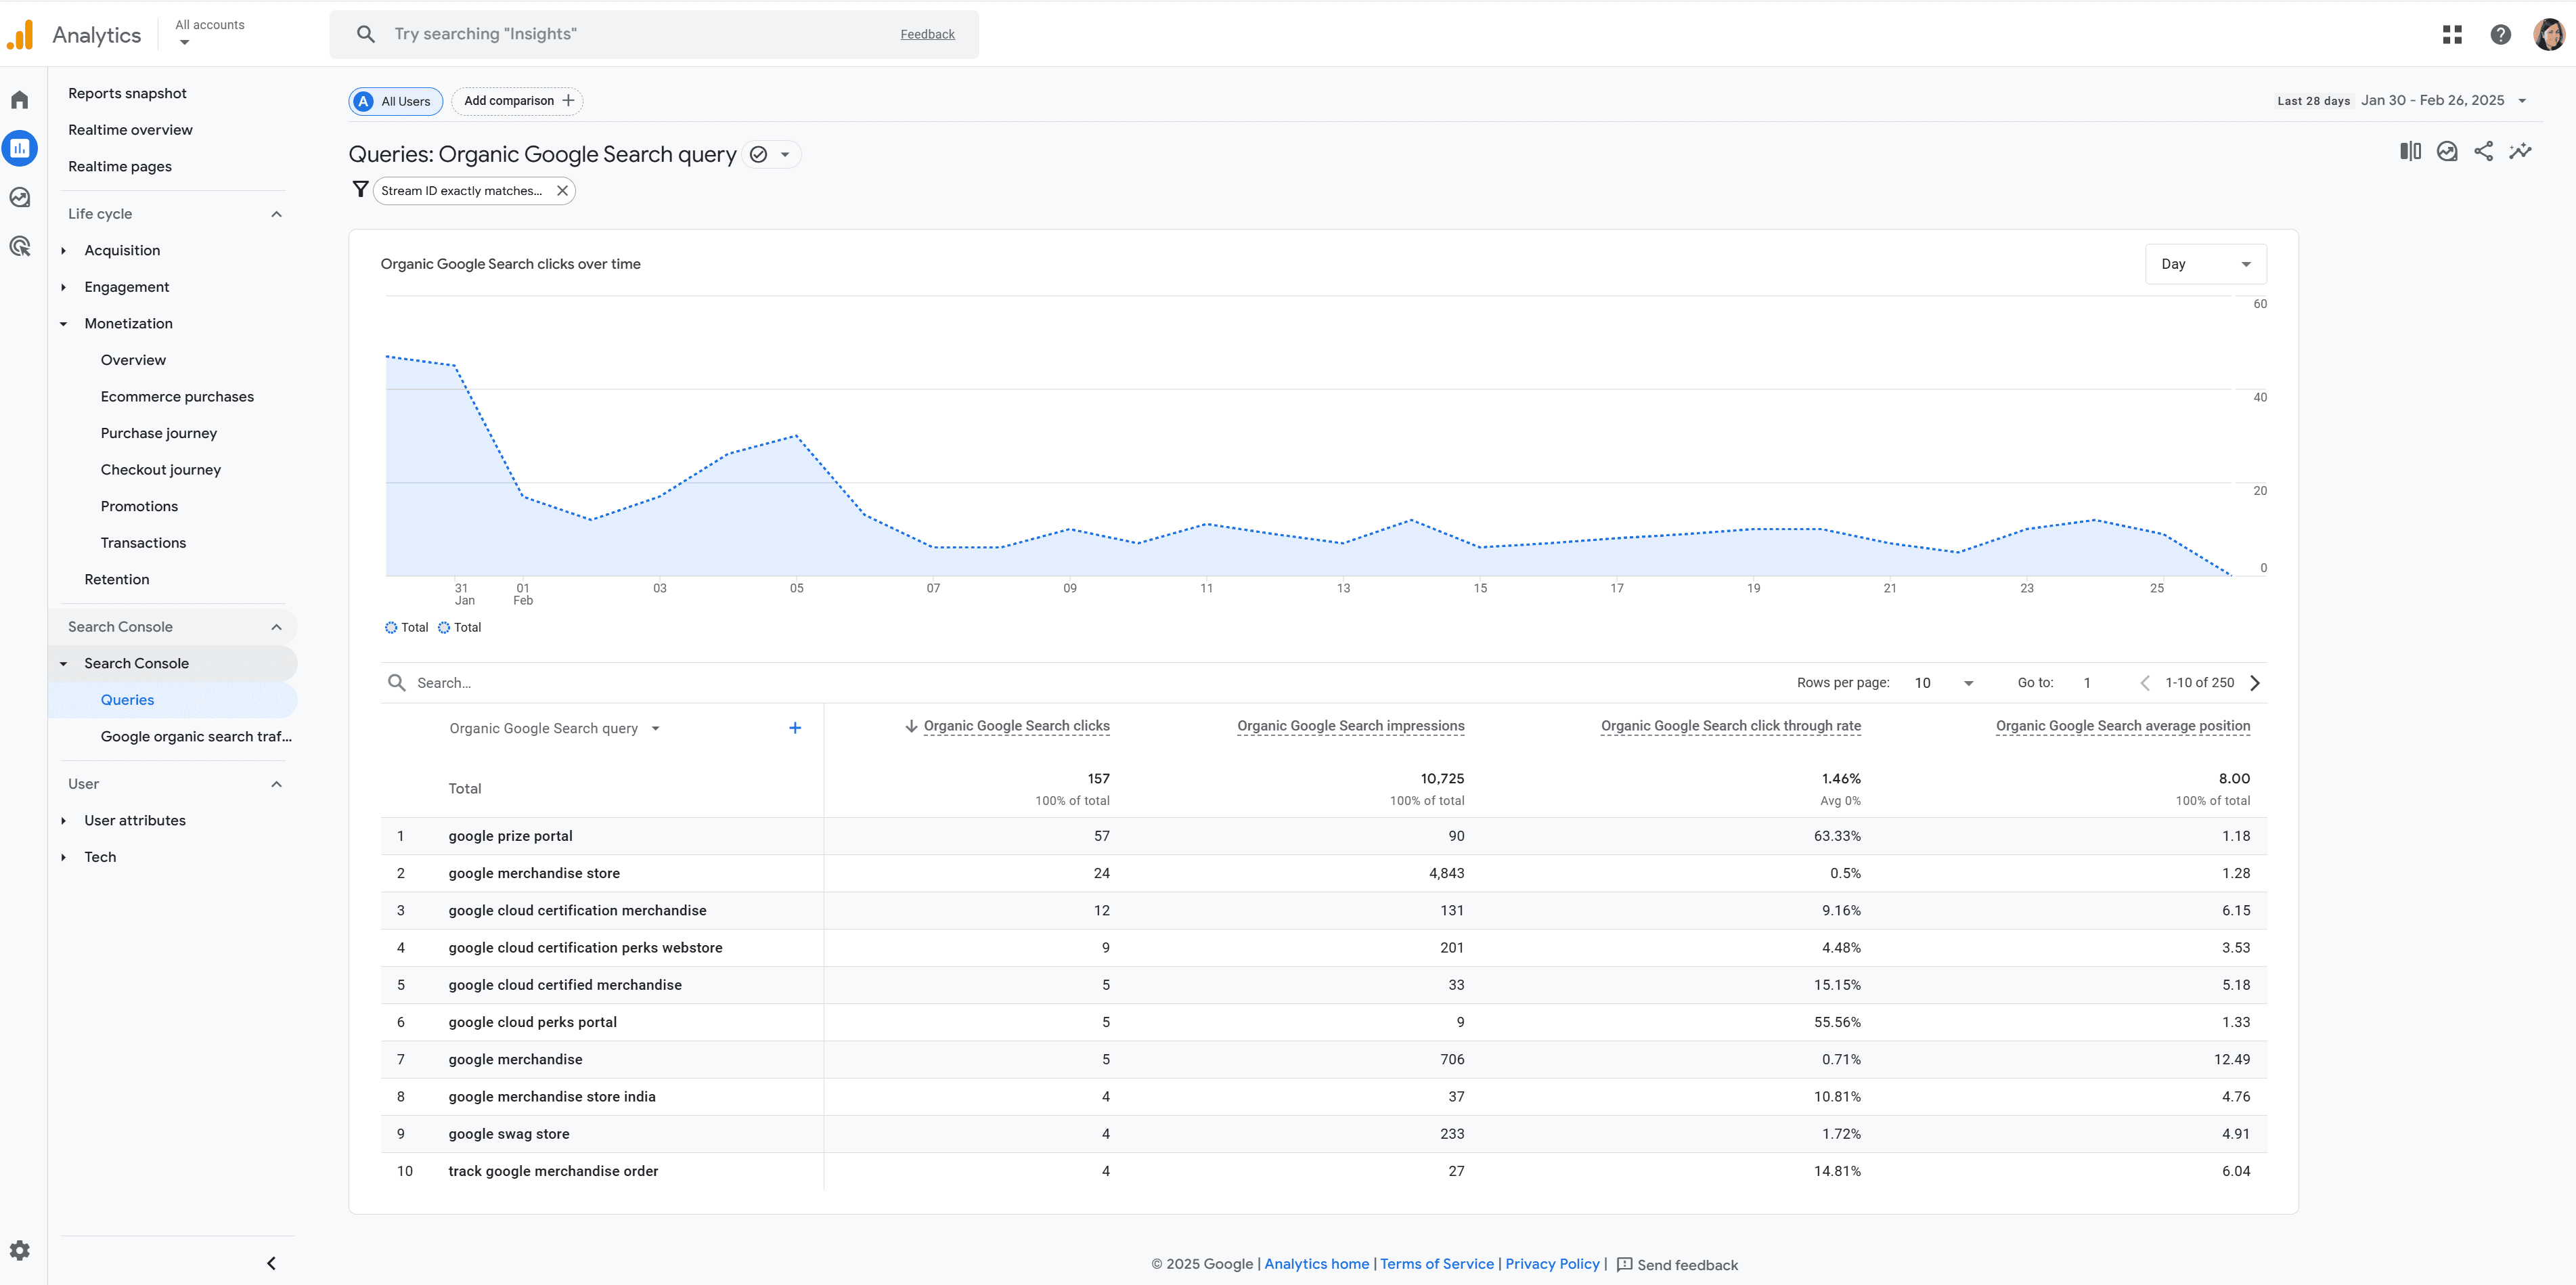
Google Analytics can be integrated with Google Search Console for deeper insights into how users find and interact with your website. You can access this information directly from within GA4 itself.
This combination allows you to align your content strategies with search intent, identify high-performing keywords and uncover opportunities for optimization. With these insights, you can make data-driven decisions to improve your search engine rankings and drive more organic traffic.
The Bad — Where Google Analytics Falls Short
Google Analytics is a powerful tool for understanding your website's performance, helping you improve customer experiences and drive conversions. But it’s not without its challenges.
A Steep Learning Curve
Google Analytics offers valuable insights but getting the most out of its advanced features takes time. Your marketing strategies are based on accuracy and it's easy to misconfigure settings like goals or data filters thereby making you miss out on valuable data.
While basics like navigating reports can be learned quickly, mastering tools like custom reports or exploratory analysis often requires weeks of training or even paid courses.
From Free to $150,000: The Cost of "Analytics 360"
For small businesses, the free version of Google Analytics delivers everything you need to monitor traffic and performance. But as your business grows, you might outgrow its limits.
Upgrading to its premium sibling called Analytics 360 unlocks advanced features like unsampled reporting, which ensures your data is accurate and complete—a must for high-traffic sites. However, with a price tag starting at $150,000 annually, it’s a significant investment that requires careful consideration.
The Problem with Sampled Data
Sampling can be a roadblock to accurate insights. Instead of analyzing all your data, Google Analytics sometimes uses a smaller subset, which can distort results—especially for high-traffic websites.
For businesses relying on precise data to make decisions, sampled results can lead to missteps. When every decision counts, complete and accurate data is non-negotiable.
The Lag in Real-Time Insights
Timing matters. Whether you’re responding to a traffic spike or optimizing a campaign, speed is crucial. Unfortunately, Google Analytics often falls behind.
Free users face a 30-minute real-time window with delays of 24–72 hours for processed data. Even Google Analytics 360 users experience delays of 1–6 hours. If your business needs immediate insights, this lag can be a major limitation.
Google Analytics Can't Do It All: The Missing Context
Google Analytics is great for understanding what happened on your website but it falls short in uncovering why. While Google Analytics can tell you how many users visited your site it falls short in explaining their actions and motivations.
A high bounce rate signals a problem—but why are visitors leaving?
Strong pageviews look promising—but are users finding what they need?
Numbers alone don’t tell the whole story. As Lloyd Tabb, founder of Looker, says:
“Your metrics influence each other. You need to monitor how. Don’t just measure which clicks generate orders. Back it up and break it down. Follow users from their very first point of contact with you to their behavior on your site and the actual transaction. You have to make the linkage all the way through.”
To truly understand your audience and drive better results you need tools that go beyond the numbers and reveal the why behind the actions.
Example: The Quantitative Metric Dilemma
To illustrate the gap between these types of data imagine you own a restaurant. Quantitative data from a tool like Google Analytics can tell you things like how many dishes were served, total revenue and which dishes are ordered most often.
This data is helpful in understanding your day-to-day success but it fails in helping you understand what’s impacting sales. It lacks the “why” behind the numbers.
Quantitative data can uncover trends but it falls short in revealing the specific experiences, preferences and motivations driving your customers’ decisions. To truly optimize your digital marketing efforts you need to understand the 'why' behind the numbers.
CRO Tools Go Beyond Data
Whether you’re running a restaurant or a website, the key to success is understanding visitor behavior, not just numbers. Use tools like Google Analytics for quantitative metrics, but let Lucky Orange's CRO tools bridge the gap:
Heatmaps – Visualize where users click, scroll, and spend time on your site.
Session Recordings – Watch live or recorded replays of how users interact with your pages.
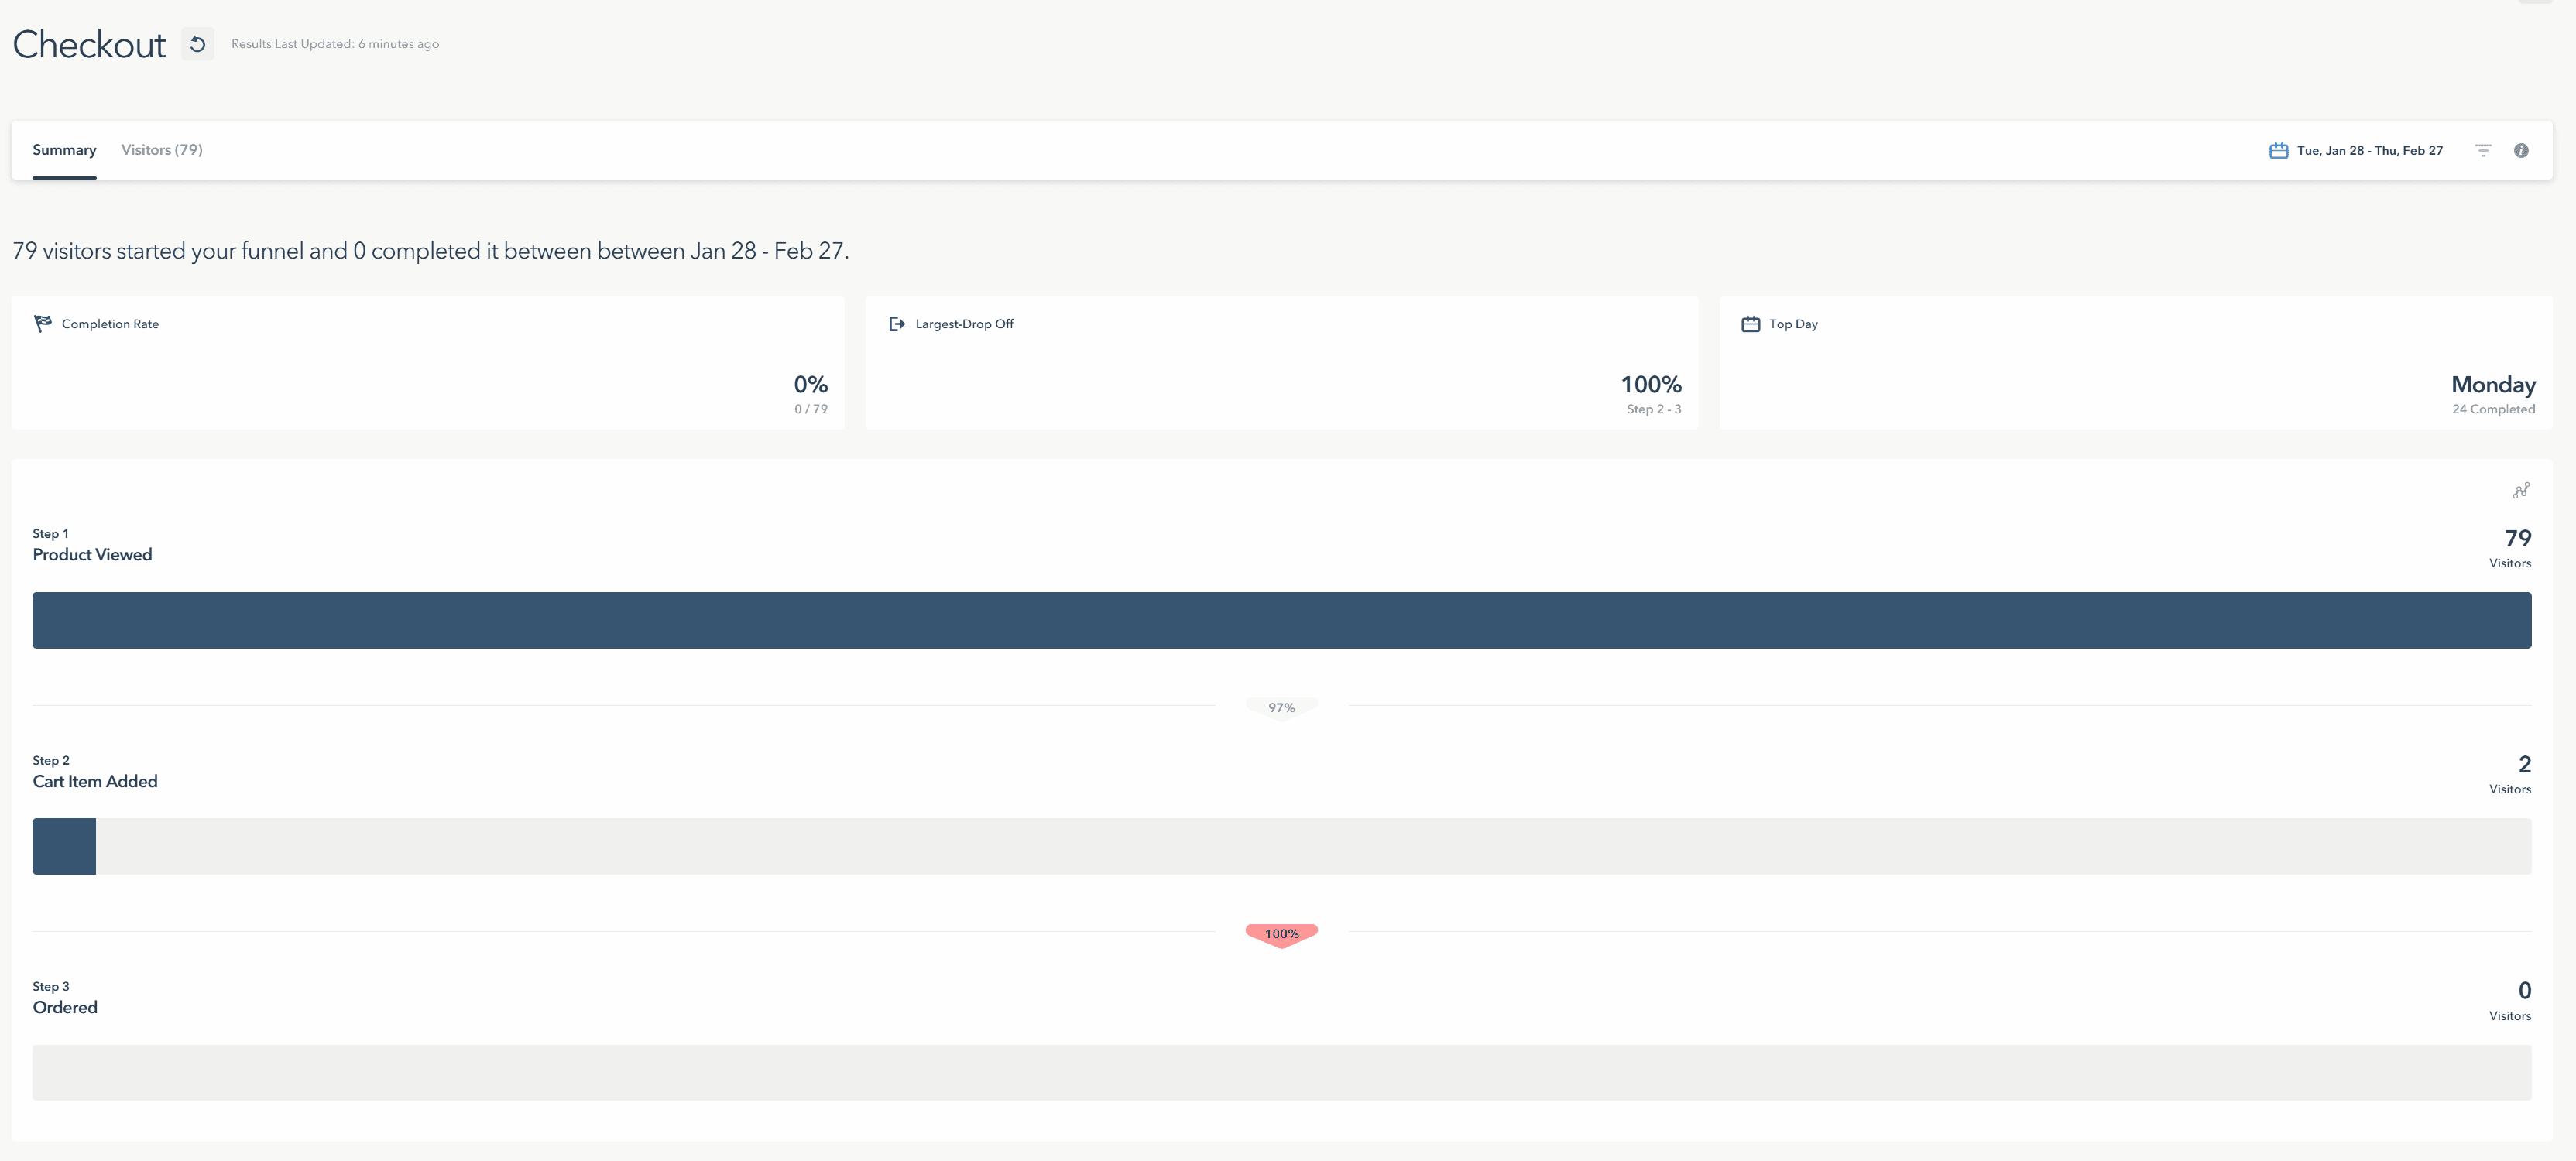
Conversion Funnels – Uncover exactly where visitors drop off during a purchase.
On-Site Surveys – Learn directly from users with targeted questions about their experience.
Find the 'Why' Behind the 'What' with User Behavior Data
Using CRO tools to supplement Google Analytics data help you dive deeper into the "why" behind user behavior, giving you actionable insights to improve your website.
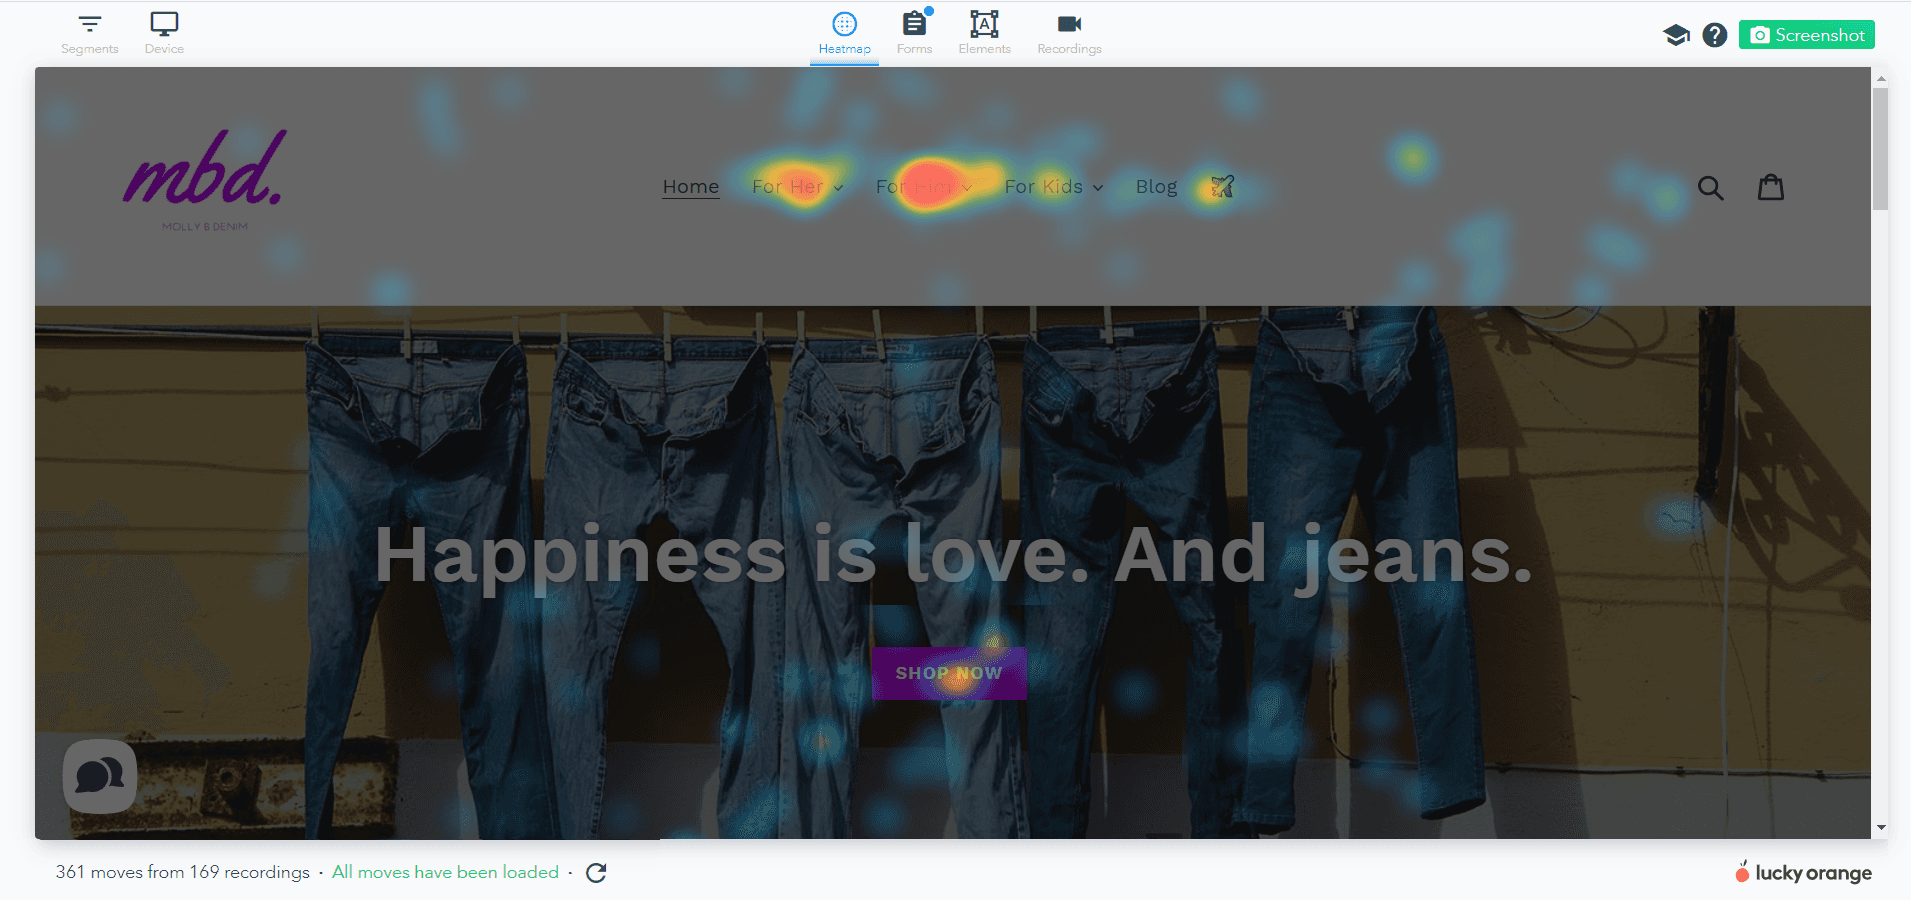
Clarity Through Visualization
Analyzing a GA4 chart can often lead to misinterpretations, especially when the data is sampled. In contrast, a dynamic heatmap makes it much clearer where users are engaging and which CTAs are driving the most impact.
If a picture is worth a thousand words, imagine the insight a session recording can provide. Watching a live recording of a user navigating your website shows critical blockers like a pop-up – even one that's well-intended – obstructing the checkout process.
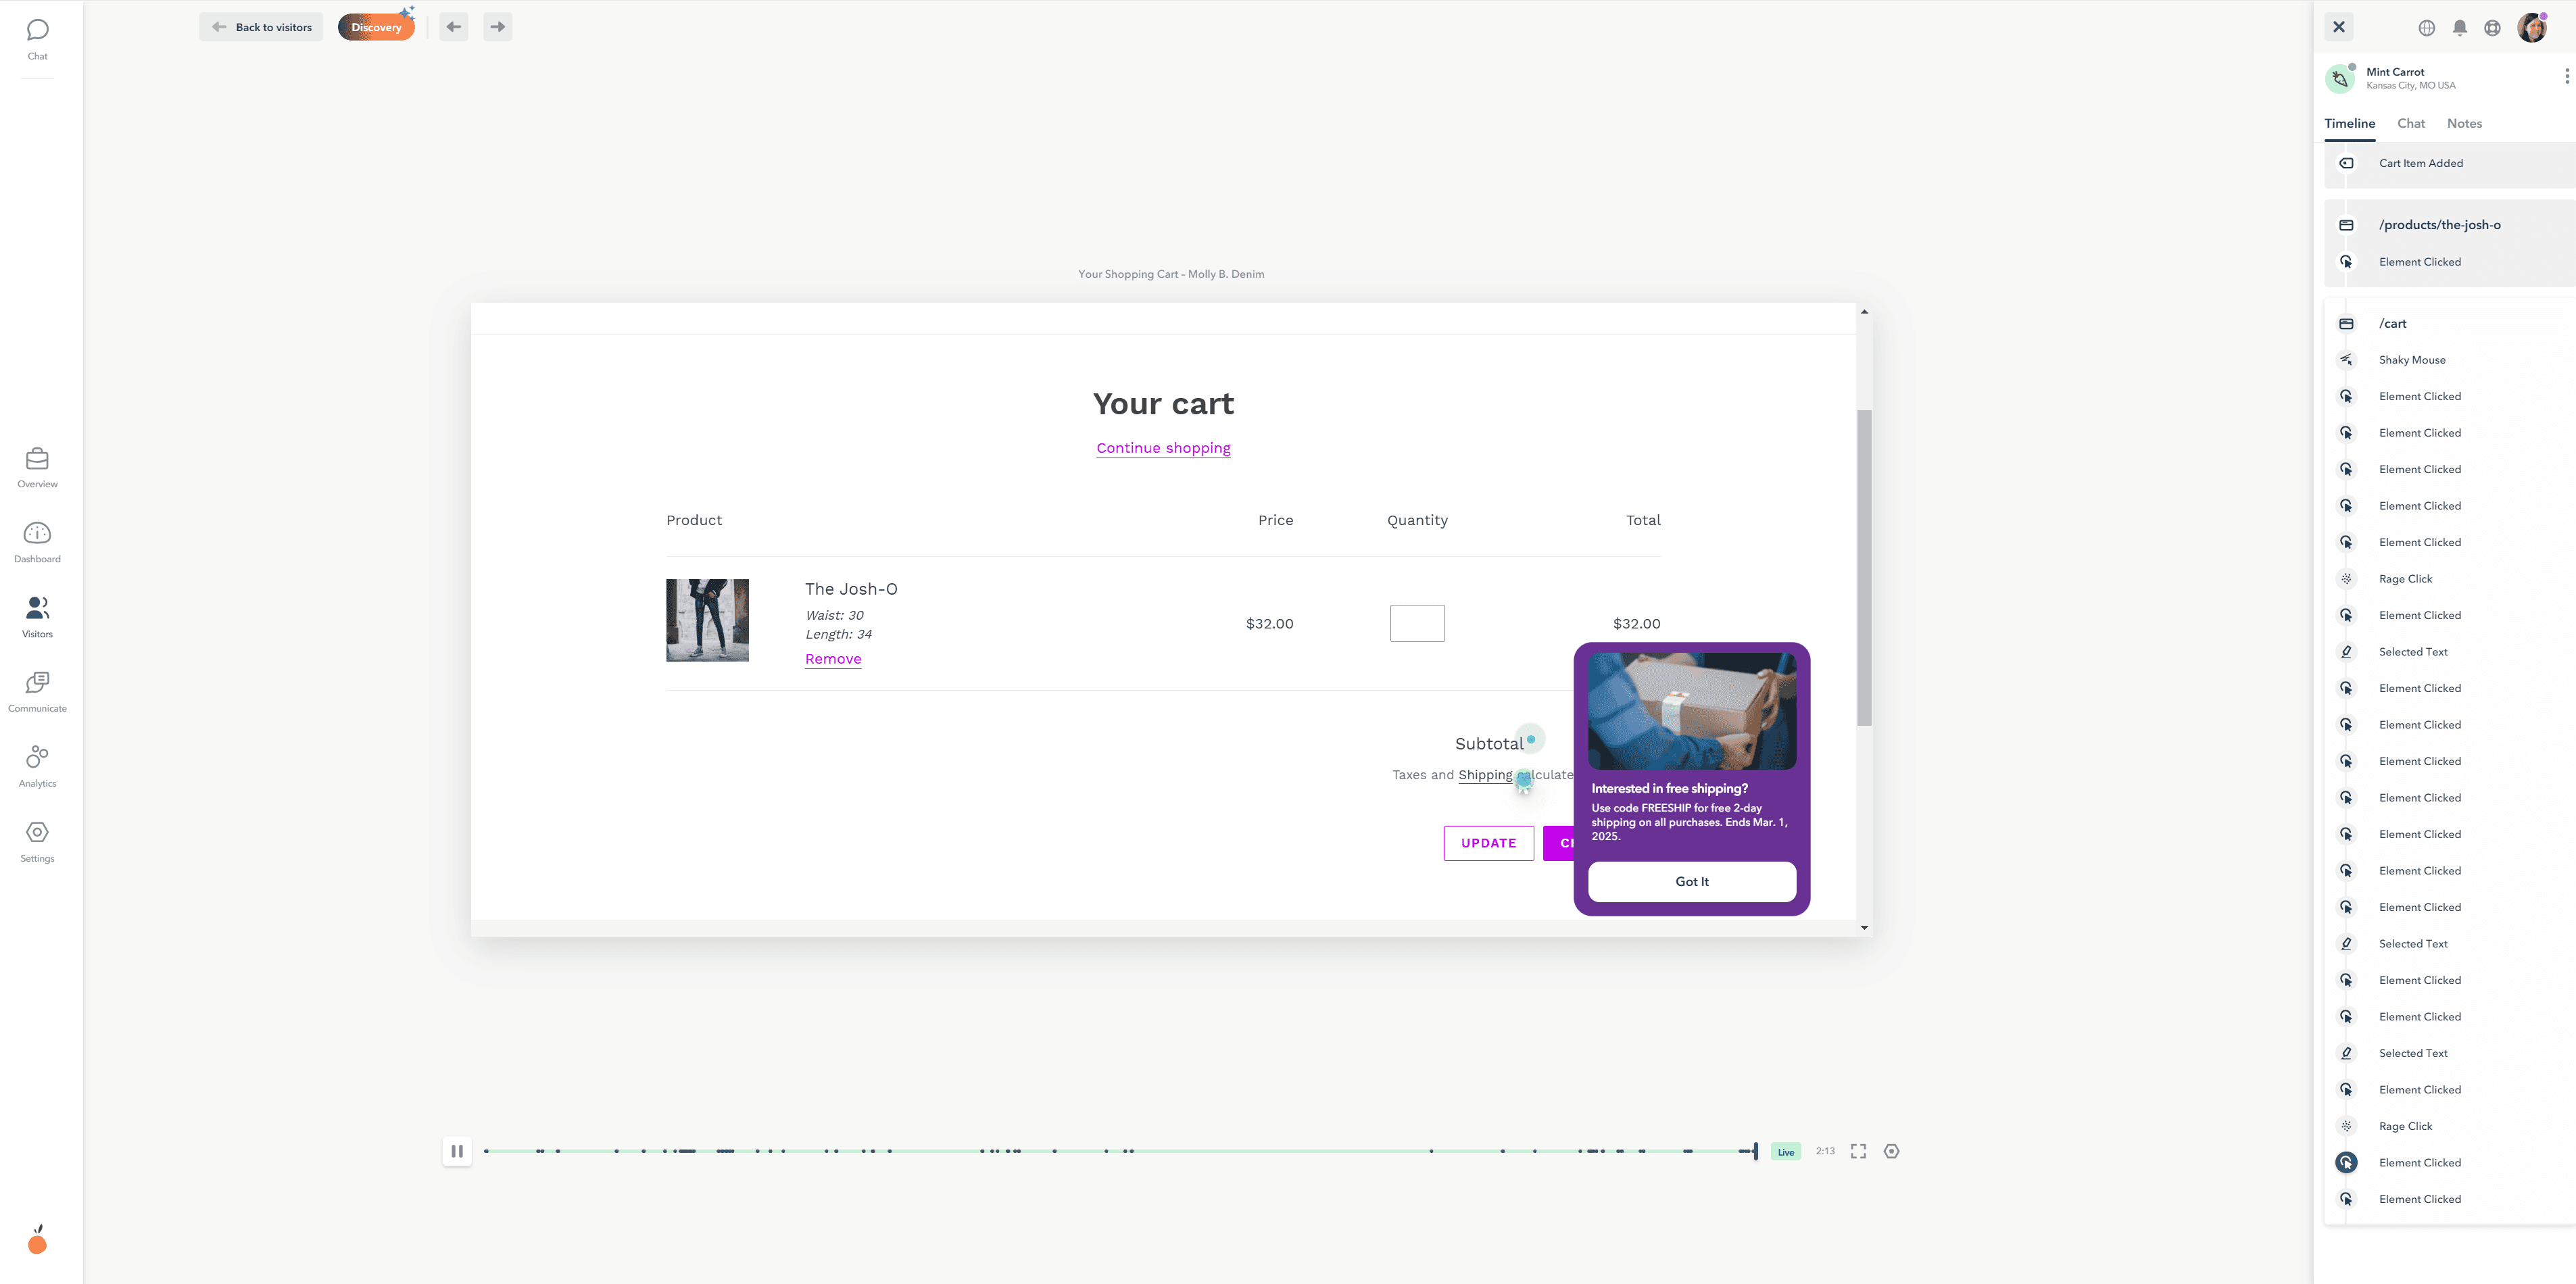
When it comes to understanding user behavior, nothing beats the power of visual context.
Gather unbiased feedback
Understanding how users interact with your website is valuable but sometimes the best insights come from simply asking their opinion.
Launch targeted surveys on specific pages or for defined audience segments such as by location or user type. Use multiple-choice questions for higher response rates, though these may provide less depth, or opt for open-ended questions to gather fewer but more detailed responses.
Connect the Digital Dots
Everything comes together seamlessly with Lucky Orange. By integrating with GA4, you can also enhance your search engine optimization efforts by gaining insights into organic traffic performance. By integrating with GA4, you can pass GA4 events into Lucky Orange and vice versa, creating a powerful flow of insights.
Use GA4 events to build conversion funnels that pinpoint exactly where visitors drop off during their journey.
Dive deeper with dynamic heatmaps to see where users are clicking, scrolling or moving their mouse. Need more detail? Jump into session recordings to uncover UX roadblocks or refine your marketing strategies with precision.
Make data-driven changes to your site, then take it a step further—launch a survey to gather visitor opinions on your updates to gain valuable actionable feedback that helps you continuously improve.