Everything You Need to Know About Exporting Survey Results From Lucky Orange
Mar 8, 2025
Published by: Lucky Orange

We’re excited to announce an update to Lucky Orange Surveys and Announcements—you can now export up to 10,000 rows of data at once.
This is a big step up from the previous limit of 1,000 rows, giving you access to more detailed information. With this update, it’s easier than ever to identify trends, understand your audience and refine your strategy.
Why Bigger Exports Matter
More data means better understanding. With up to 10,000 rows available, you can spot patterns, track trends, and make smarter decisions based on clear, actionable information.
Here's how to use it inside Lucky Orange
Export Your Data
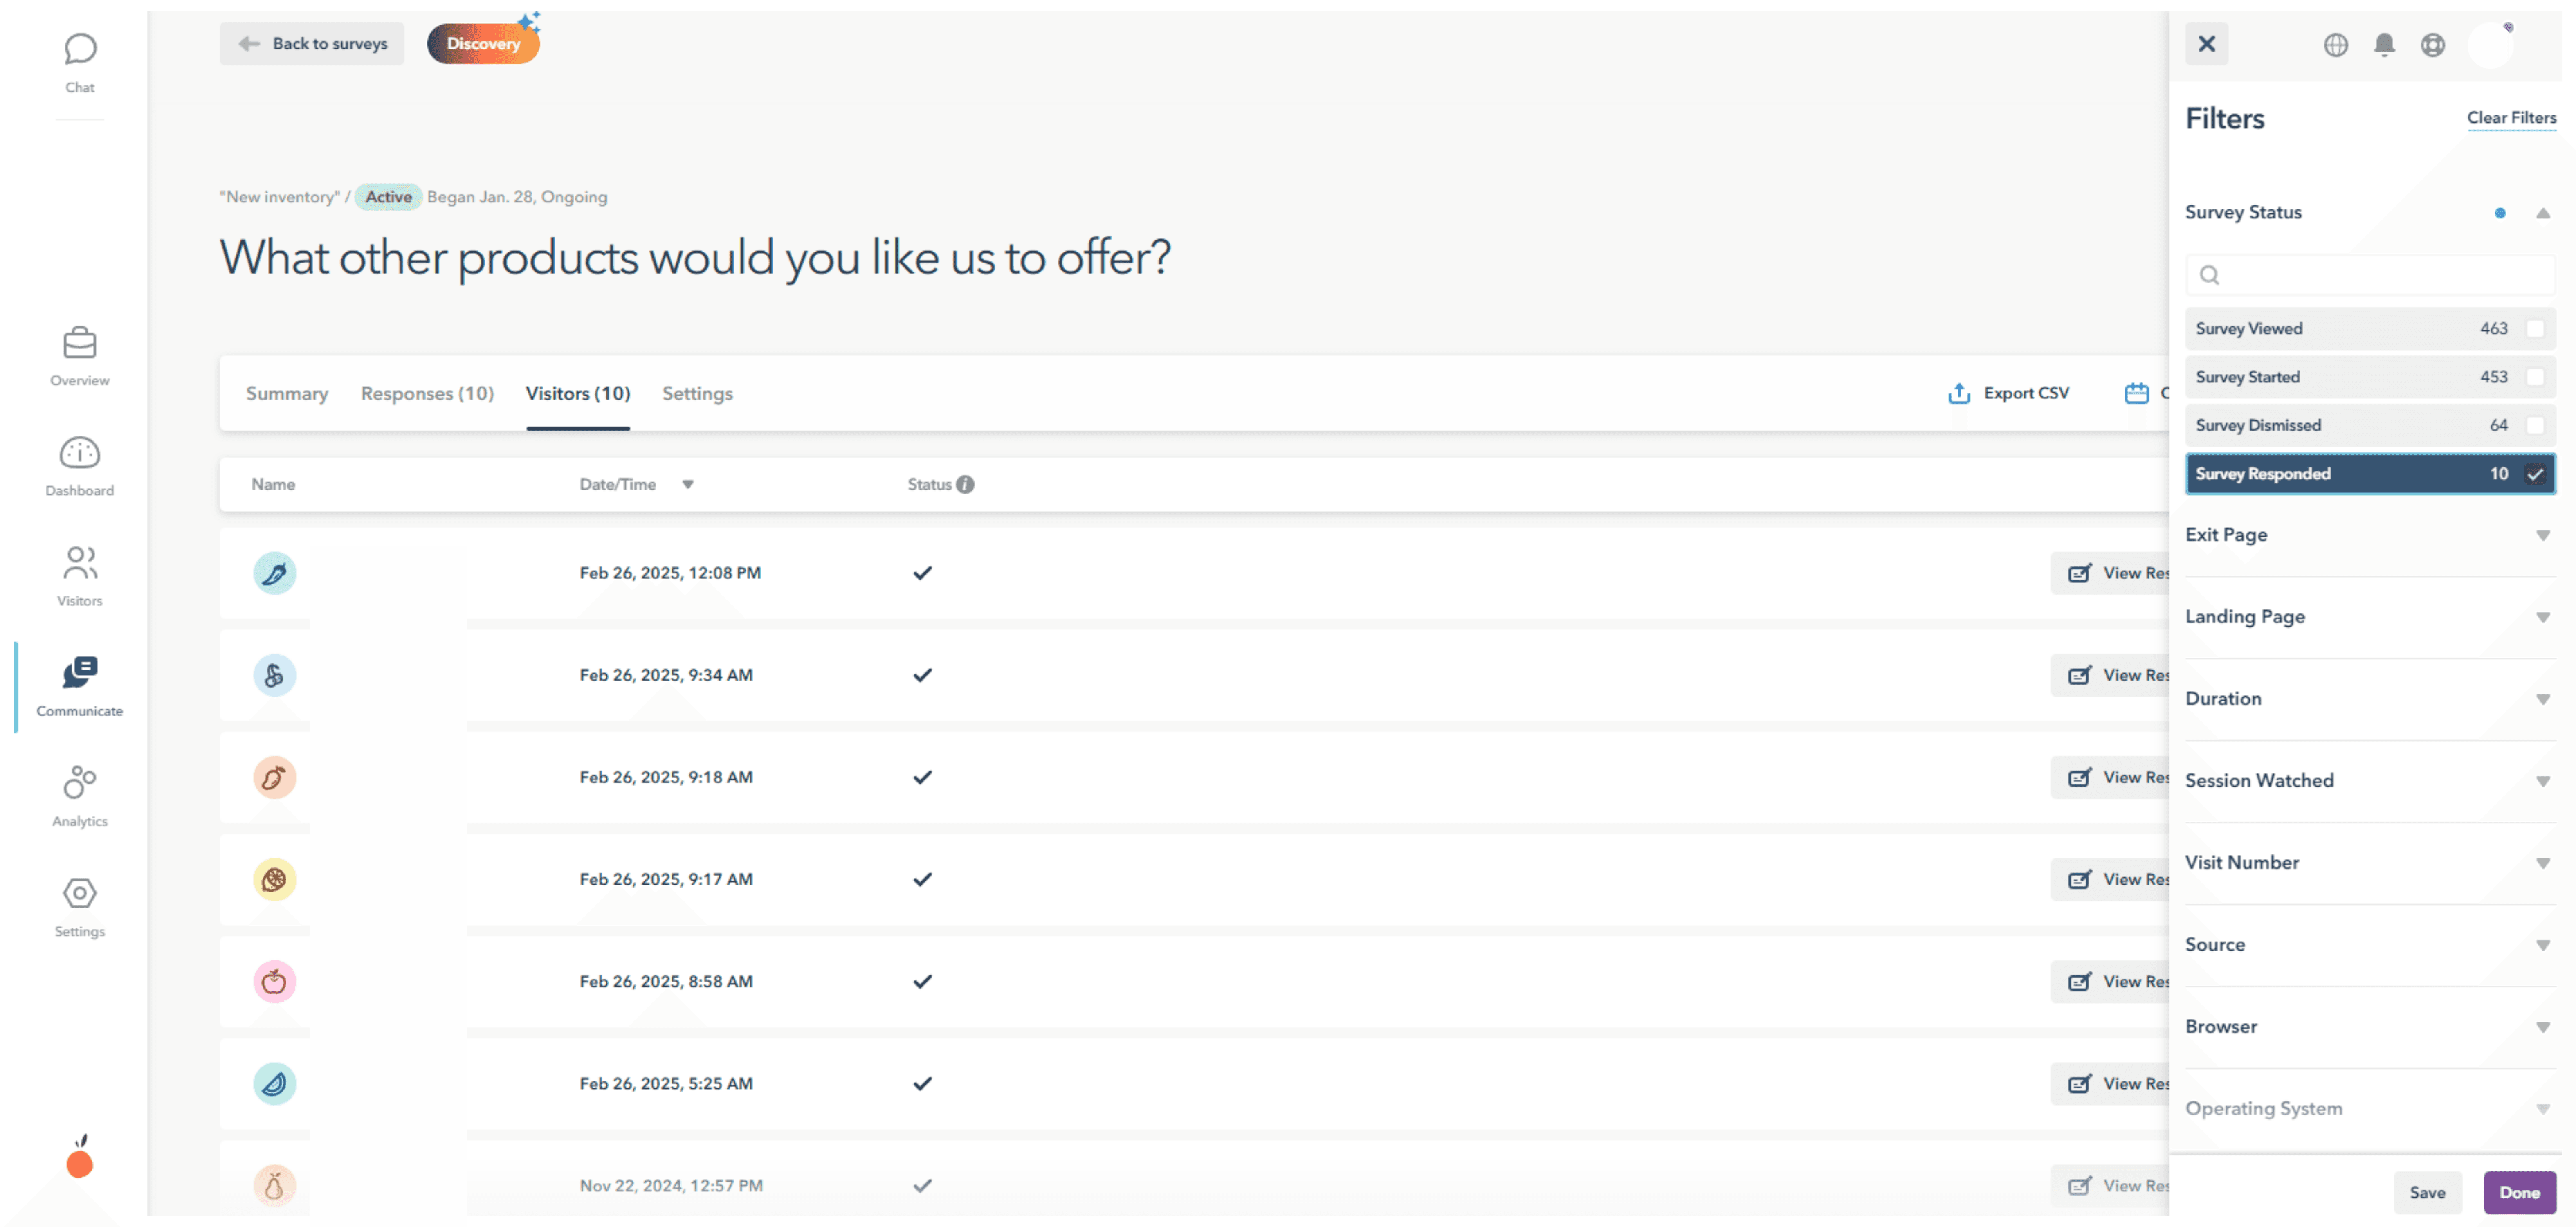
Navigate to Communicate → Surveys (or Announcements) → View Results → Visitors. Apply Filters such as Survey Responded or Feedback Given, then download your data by selecting Export CSV.
Identify Trends and Insights
Analyze survey responses to uncover key themes, patterns, and trends. Export your survey data and use an AI tool that can process large volumes of text to categorize sentiments, summarize feedback, and highlight recurring topics.
For instance, if you have open-ended responses from a customer satisfaction survey, ask the tool to:
"Summarize the most common issues raised, group them into key themes, and identify overall sentiment (positive, negative, or neutral)."
This method helps identify important insights, such as frequent concerns about delivery times or consistent praise for customer service, providing a clear understanding of your audience's expectations and areas for improvement.
Take Meaningful Action
By analyzing customer feedback and identifying common patterns, you can make informed decisions to improve your services and address specific issues.
For example, if recurring complaints highlight a slow response time, you can prioritize faster customer support. Use these observations to adjust your offerings, fix ongoing problems, and plan for growth with clear, actionable steps. A focused approach ensures your efforts are practical, effective, and directly benefit your customers.
Types of Trends to Spot In Survey Result Analysis
Customer surveys are more than just feedback—they're a treasure trove of patterns waiting to be uncovered.
These patterns reveal exactly where to focus your efforts—whether it’s refining your website, improving products, enhancing support or testing new ideas. Dive into the data, and let these insights guide smarter decisions and bigger results.
Website Usability
Look for specific comments about user navigation, such as difficulties finding information, confusion over menu layouts, or frustration with slow page loading.
Pay attention to repeated mentions of issues like broken links, missing accessibility features (e.g., lack of screen reader compatibility), or poorly designed call-to-action buttons. These patterns in feedback can help you identify exactly where users are struggling, allowing you to focus improvements on the most critical areas.
Product Offerings
Survey responses might highlight clear preferences for certain products through repeated positive mentions (e.g., "I love how durable Product X is").
On the flip side, negative feedback like “Product Y breaks easily” or “It’s too expensive for its value” can point to specific weaknesses in your lineup. Requests for missing features or common themes like “I wish this came in a smaller size” can indicate gaps in your offerings, while trends in price complaints may suggest the need for adjustments to pricing strategy.
Purchase Methods
Responses often reveal frustrations with payment systems, such as “I wish more payment options were available” or “The checkout process took too long.” Look for mentions of abandoned carts and reasons like “I didn’t trust the payment platform” or “It kept asking for too much information.” These details can help pinpoint roadblocks in your purchase funnel. Positive feedback, such as “The one-click checkout was so easy,” can also show what’s working well and should be emphasized.
By carefully analyzing these detailed survey comments and identifying recurring themes, your team can better prioritize actionable improvements that directly address customer pain points, build trust, and foster loyalty for long-term success.