
Blog
Conversion Rate Optimization
Conversion Rate Optimization: The Complete Guide (2026)
Learn what CRO is, why it matters, and how to build a program that turns more visitors into customers — using behavioral data, A/B testing, and AI-assisted insights.
Lucky Orange

Getting more traffic is expensive. Converting the traffic you already have is where the real leverage is.
Conversion rate optimization (CRO) is the systematic process of increasing the percentage of website visitors who complete a desired action — a purchase, a signup, a demo request, a form submission. The average website conversion rate across industries sits between 2% and 5%. Most businesses are leaving significant revenue on the table simply because they don't know why their visitors aren't converting.
This guide covers everything you need to build a CRO program that works: what conversion rate optimization actually is, how to measure it, the strategies that move the needle, and how behavioral data — not guesswork — should be driving every decision you make.
What's in this guide:
What is conversion rate optimization (CRO)?
Why CRO matters: the business case
Key CRO strategies and techniques
Ecommerce conversion rate optimization
The 9-step CRO process
CRO tools: what you need and why
How AI is changing conversion rate optimization
CRO as a continuous improvement program
Frequently asked questions
What Is Conversion Rate Optimization (CRO)?
Conversion rate optimization is the process of improving a website or app to increase the percentage of visitors who complete a desired action. A conversion is any action that moves a visitor closer to becoming a customer — making a purchase, signing up for a free trial, submitting a contact form, or requesting a demo.
Your conversion rate is the percentage of users who completed that desired action compared to the total number of visitors.
The formula is simple:
FORMULA Conversion Rate = (Number of Conversions / Total Visitors) x 100 |
So if 15,000 people visit a landing page in a month and 300 complete a signup, your conversion rate is 2%. That's a reasonable baseline, but the real goal isn't to hit a universal benchmark — it's to improve your own rate continuously over time.
CRO works hand-in-hand with other digital marketing strategies. SEO and paid search bring visitors in. CRO turns those visits into action. When you improve conversion rates, every dollar you've already spent on acquisition works harder.
What counts as a conversion?
Conversions fall into two categories:
Macro conversions are your primary business goals — completed purchases, paid signups, demo requests, quote submissions. These directly generate revenue or pipeline.
Micro conversions are the smaller steps that signal intent — adding a product to a cart, watching a video, downloading a resource, clicking a pricing page. They predict macro conversion behavior and help you understand where visitors are in their user journey.
Both matter for a complete CRO strategy. Tracking micro conversions helps you understand the full conversion funnel, not just the final step.
What is a good conversion rate?
The average conversion rate across industries is typically between 2% and 5%, though this varies widely by industry, traffic source, and what you're asking visitors to do. Financial services and SaaS free trial signups often outperform ecommerce transaction rates. Organic search traffic converts better than display advertising traffic.
The most useful benchmark is your own site's current conversion rate. A jump from 2% to 3% is a 50% increase in conversions — achieved without spending anything more on acquisition. That's the power of CRO.
TIP Even a 1% lift compounds dramatically. 10,000 monthly visitors at 2% = 200 conversions. At 3% = 300 — a 50% revenue increase from the same traffic. |
Why Conversion Rate Optimization Matters
Most marketing budgets are heavily weighted toward traffic generation. But the moment visitors land on your site, the investment is already made. CRO is about maximizing the return on that investment.
Lower customer acquisition costs
Improving your website's conversion rate means each new customer costs less to acquire. If your current CAC is $200 and you double your conversion rate, your effective CAC drops to $100 — without changing a single ad or keyword. Lower customer acquisition costs are one of the most direct business outcomes of a sustained CRO program.
More revenue from existing traffic
You don't need more website visitors to grow revenue — you need more of your existing traffic to convert. CRO focuses on extracting more value from the audience you've already earned, making it one of the most capital-efficient growth levers available.
Better user experience
CRO and UX are inseparable. The friction that stops visitors from converting — confusing navigation, slow load times, unclear messaging, forms with too many fields — is the same friction that creates a bad user experience. Fix conversion problems and you improve the experience for everyone. That leads to higher engagement, lower bounce rates, and better SEO performance as a downstream effect.
Deeper understanding of your audience
A CRO program forces you to understand how people actually behave on your site — not how you think they behave. The insights you gain from analyzing user behavior feed back into better marketing, better product decisions, and better customer experiences across every touchpoint.
Case Study: Interplay Learning Boosts Demo Conversions by 183%

Interplay Learning needed to understand why visitors weren't converting on their most important pages — pricing, demo signup, and educational content. Their quantitative analytics showed bounce rates and time-on-page, but couldn't explain what was actually happening on those pages.
Using Lucky Orange's dynamic heatmaps and session recordings, the team identified specific friction points and began testing layout changes. Their most significant test: hiding visible pricing on their pricing page. The result was a conversion rate jump from 6% to 17% for demo signups — a 183% increase.
KEY RESULTS
|
Three more examples of behavioral data driving conversion gains:
FTX POS: Uncovered how organic traffic was behaving post-click, turning SEO visitors into qualified leads.
Stenbolaget: Identified friction in their ecommerce experience and streamlined the path to purchase for a Shopify Plus store.
Broken Tractor: Discovered layout and messaging issues blocking conversions, enabling targeted fixes that moved the needle quickly.
Key CRO Strategies and Techniques
Effective conversion rate optimization isn't a single tactic — it's a combination of strategies applied where they'll have the most impact. Here are the core levers every CRO program should be pulling.
1. Lead with a clear value proposition
Every page on your site should answer one question immediately: why should this visitor choose you? A strong value proposition is specific, speaks to a real problem, and differentiates you from alternatives.
Skip the jargon. 'Understand why visitors aren't converting' lands harder than 'advanced behavioral analytics platform.' Your value proposition should be instantly clear on your homepage, landing pages, and product pages.
2. Optimize your landing pages
Landing pages are where conversion optimization has the fastest, most measurable impact. Every element — headline, hero image, body copy, CTA, and form — should serve one purpose: moving the visitor to the next step.
Align landing page content with the intent behind the traffic source. A visitor from a paid search ad for 'shopify analytics' has different expectations than someone from a blog post. Match the message to the moment, reduce distractions, and make the desired action obvious.
Techniques that reliably lift landing page conversion rates: removing navigation menus from standalone pages, using directional cues toward the CTA, and keeping the most important information and primary CTA above the fold.
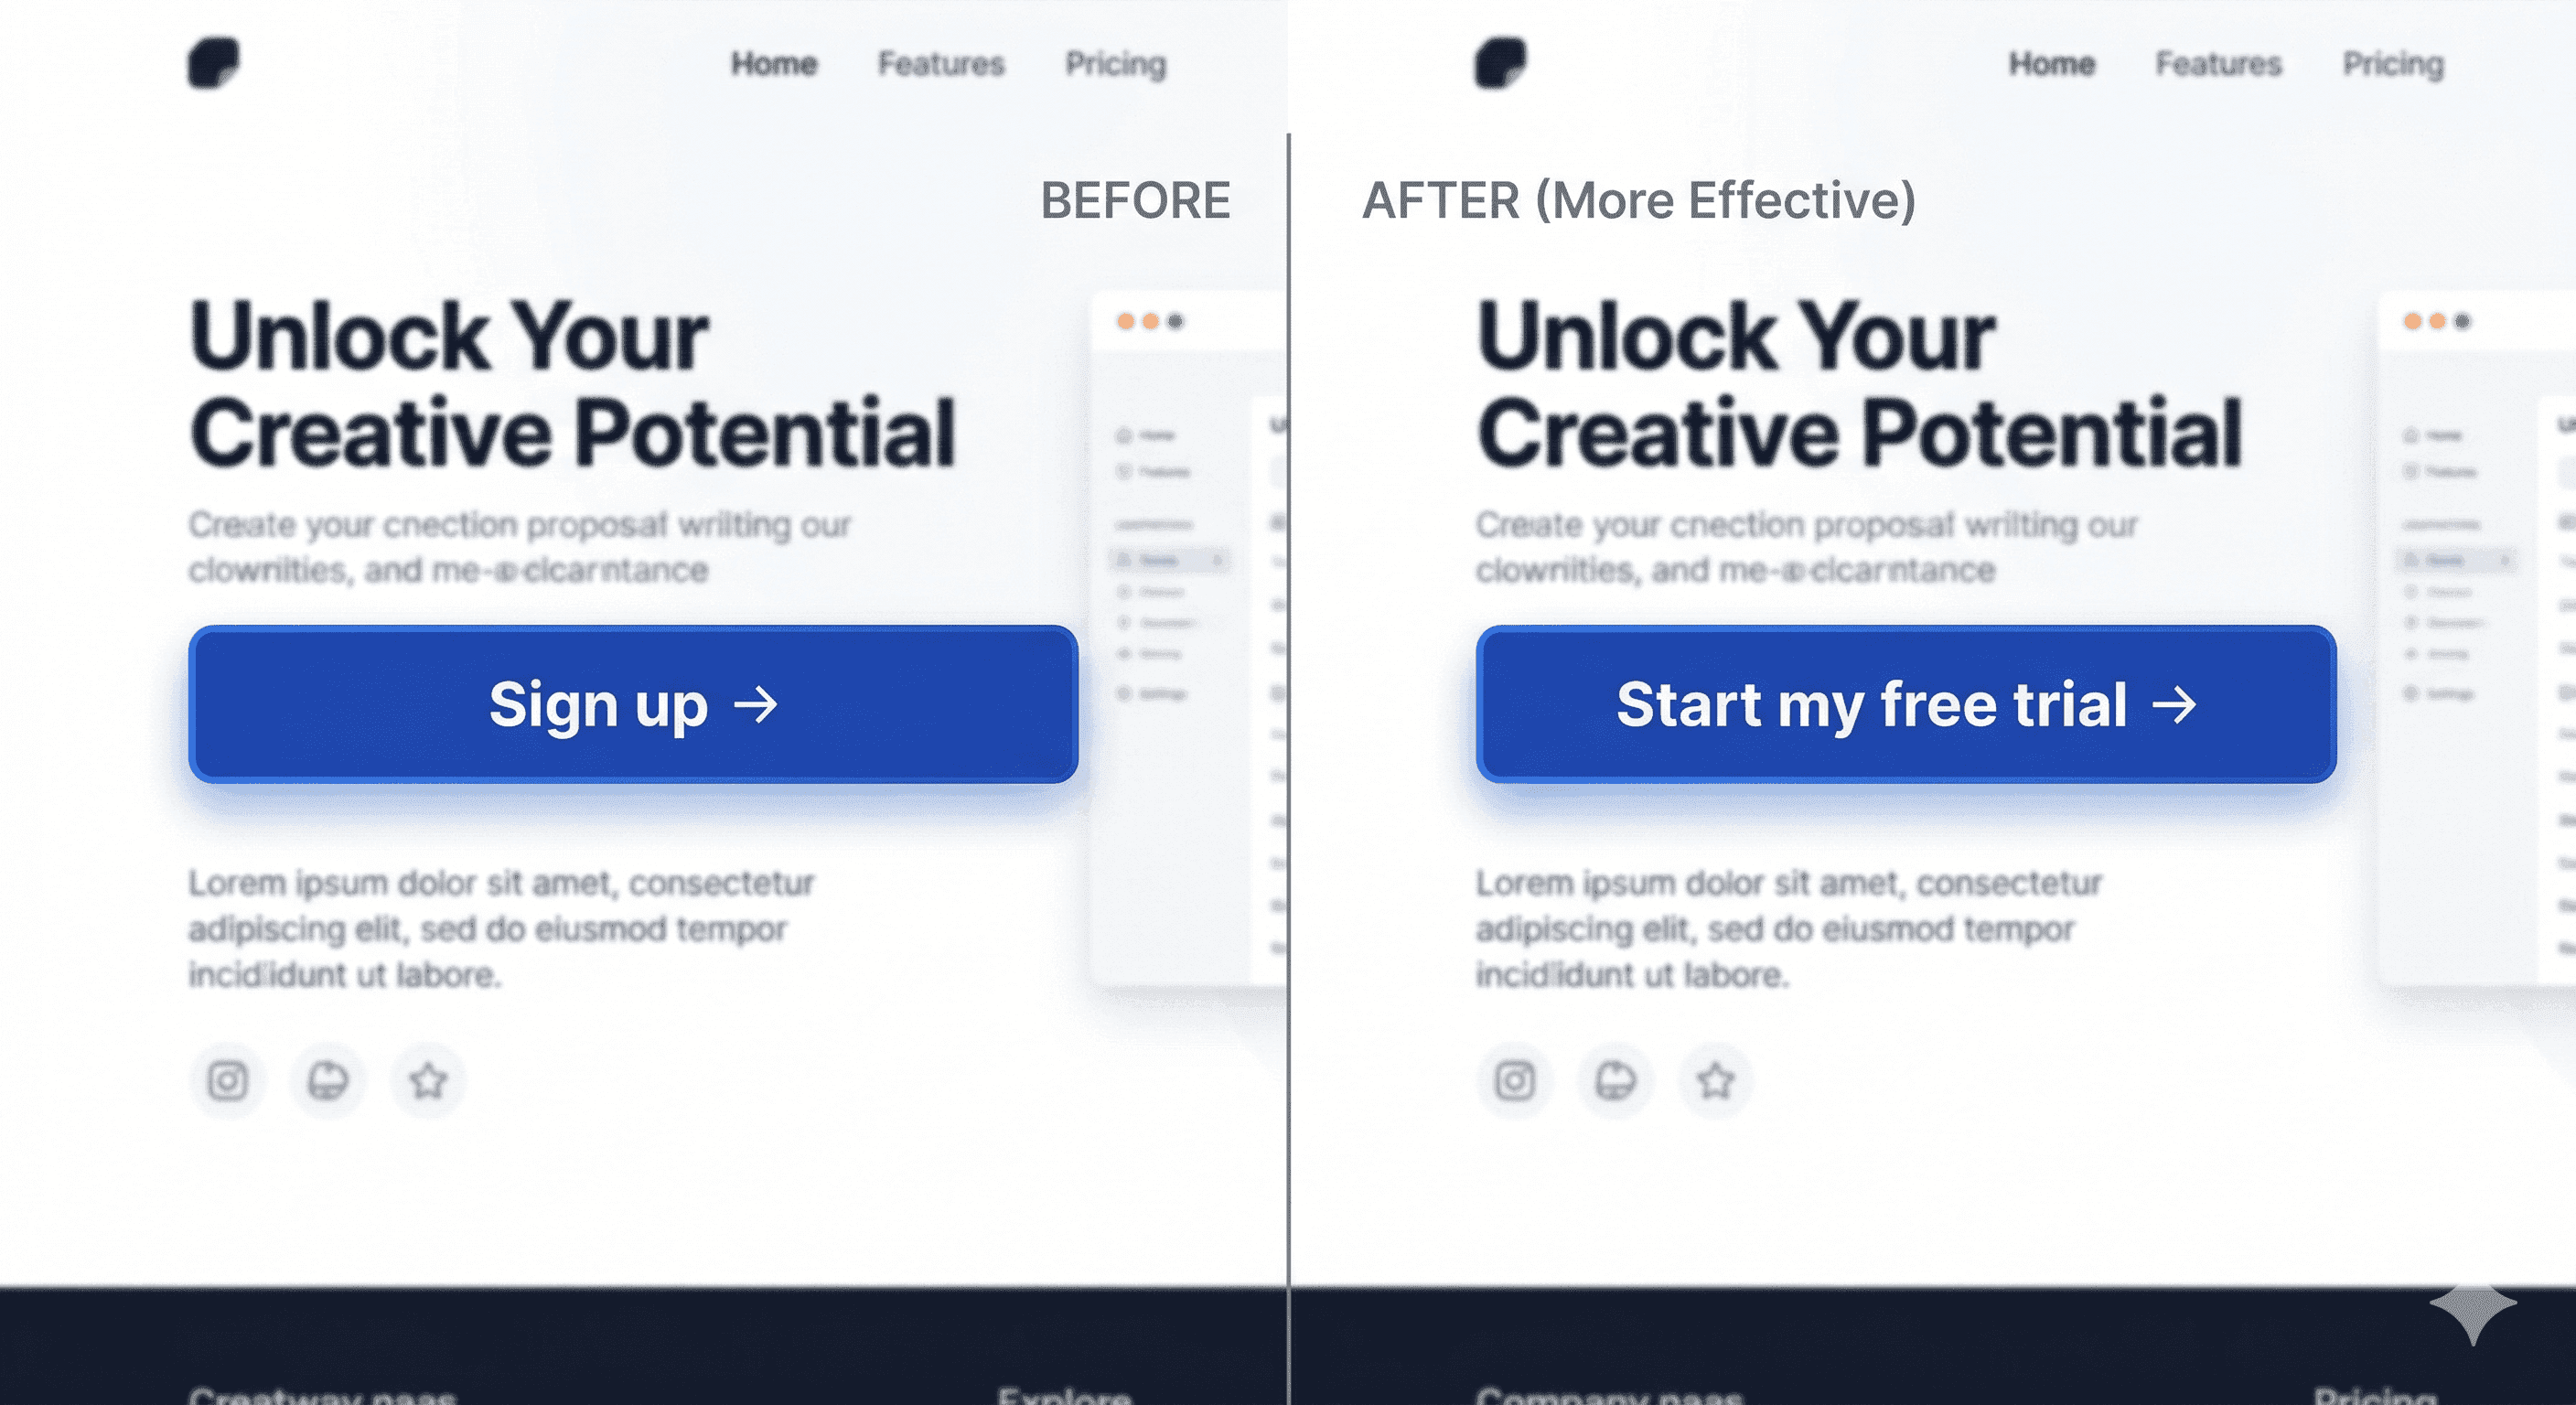
3. Write stronger calls to action
Your CTAs should be direct, specific, and focused on what the visitor gets — not what they have to do. 'Start my free trial' outperforms 'Sign up' because it emphasizes the benefit and reduces perceived commitment.
Place CTAs in high-visibility locations: above the fold, after product descriptions, following testimonials, and at the end of long-form content. On long pages, repeat the primary CTA multiple times — but keep the message consistent. Conflicting CTAs create decision paralysis.
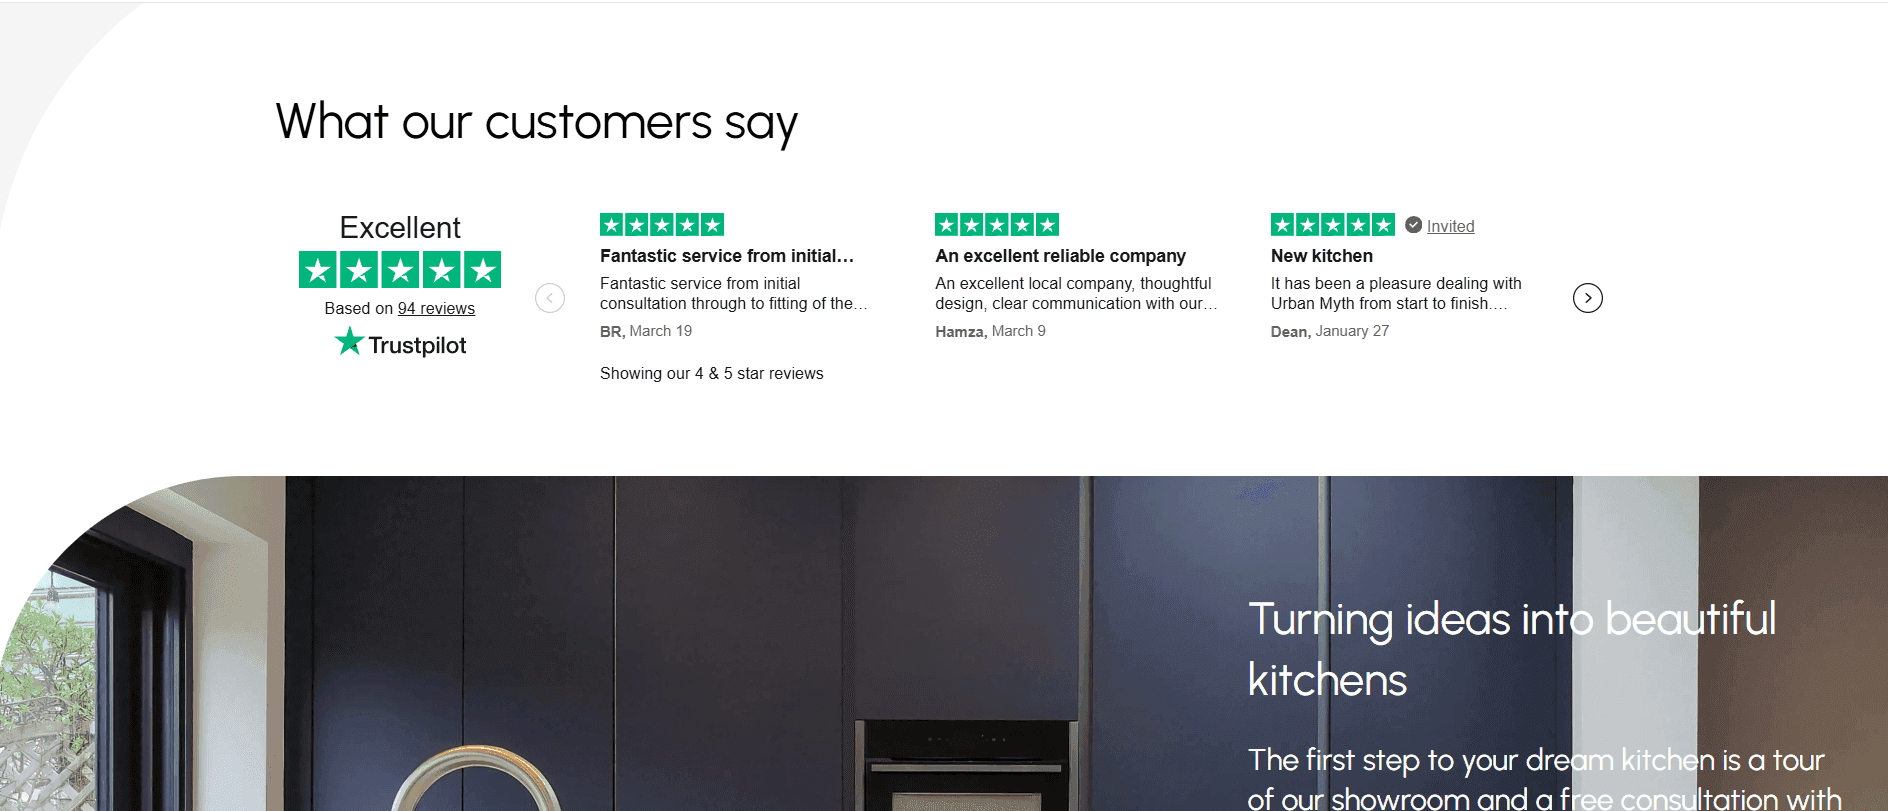
4. Use social proof strategically
Social proof — testimonials, reviews, case study results, customer logos, usage statistics — reduces the uncertainty that stops visitors from converting. It works especially well near CTAs or checkout steps, where hesitation is highest.
The most effective social proof is specific and credible. '183% increase in demo conversions' outperforms 'great tool for marketers.' A named customer with a job title outperforms an anonymous quote. Real results beat vague endorsements every time.
5. Eliminate slow load times
Every extra second a page takes to load costs you conversions. Research consistently shows that slow load times increase bounce rates and directly reduce revenue — especially on mobile devices.
Use Google PageSpeed Insights or GTmetrix to benchmark performance. Common fixes: compress and lazy-load images, minimize JavaScript execution, enable browser caching, use a CDN. For ecommerce sites, checkout page speed deserves special attention.
6. Optimize for mobile devices
More than half of web traffic is now on mobile devices, and mobile conversion rates typically lag behind desktop — not because mobile users are less likely to convert, but because most sites are harder to use on a small screen.
Responsive design is the baseline, not the goal. Use large touch-friendly buttons, simplify forms with autofill support, eliminate horizontal scrolling, and test your checkout flow specifically on mobile. Heatmaps and session recordings filtered to mobile visitors are often the fastest way to identify mobile-specific drop-off.
7. Simplify navigation and site structure
Confusing navigation breaks the conversion funnel by sending people in the wrong direction. Every unnecessary click between a visitor's entry point and their conversion goal is an opportunity to lose them.
Audit your navigation with real user data. Heatmaps show you exactly where attention is going — and where it isn't. Let that data drive your information architecture decisions.

8. Streamline forms and checkout
Every field in a form is a potential exit point. The shorter and simpler the form, the higher the completion rate. Start by auditing which fields you actually need versus which ones you're collecting out of habit.
Beyond field count, form UX matters: real-time validation, smart defaults, autofill support, and clear error messages all improve completion rates. For ecommerce, guest checkout is non-negotiable — forcing account creation before purchase is one of the highest-friction decisions you can make.
Use form analytics to see exactly where users abandon forms, which fields cause hesitation, and where errors occur most frequently.
9. Use behavioral analytics to understand your visitors
Numbers tell you what happened. Behavioral data tells you why.
Tools like heatmaps, scrollmaps, and session recordings show exactly how real users interact with your site: where they click, how far they scroll, where they get confused, and where they give up. This is the qualitative layer that aggregate analytics alone can't provide.
Heatmaps reveal whether visitors are clicking on non-link elements, ignoring CTAs, or not scrolling far enough to see your most important content. Session recordings let you watch individual visitor journeys and identify patterns — rage clicks, u-turns, hesitation loops — that signal friction worth fixing.
Try Lucky Orange for free to actually understand your website visitors. |
|---|
10. Collect user feedback
Analytics show you behavior. Surveys and feedback tools show you intent and reasoning. The two together give you the full picture.
On-site surveys — especially exit-intent surveys and post-purchase surveys — are underused CRO assets. A single question like 'What almost stopped you from signing up?' can surface objections and friction points that no amount of data analysis would reveal. Keep surveys short (1-3 questions), time them contextually, and act on what you learn.
Live chat logs are another underutilized data source. The questions visitors ask before converting are a map of your conversion funnel's anxiety points. If the same question comes up repeatedly, the answer belongs on the page.
11. Test, don't guess: A/B testing
A/B testing removes opinion from conversion optimization and replaces it with evidence. It works by showing different versions of a page or element to different audience segments simultaneously, then measuring which version drives better conversion performance.
Test one variable at a time — a headline, a CTA button, a form layout — so you know exactly what caused the difference. Run tests long enough to reach statistical significance before drawing conclusions.
The strongest tests are grounded in behavioral data: you observe a drop-off in session recordings, form a hypothesis about why it's happening, then test a fix. That's the difference between a testing program and organized guessing.
12. Personalize for your target audience
Not all visitors are the same, and a one-size-fits-all experience leaves conversion rate on the table. Start with the basics: different messaging for new vs. returning visitors, campaign-specific landing pages that match the ad that brought someone in, or behavior-triggered popups for exit-intent visitors.
13. Look at UX holistically
Conversion optimization is ultimately a UX problem. Visitors don't convert because something in their experience is getting in the way — unclear messaging, a confusing layout, a missing piece of information, or a technical issue they can't work around.
Audit your site from the perspective of a first-time visitor with no context. Is the value proposition clear in the first five seconds? Is the primary action obvious? Behavioral data helps you answer these questions — and the fixes are usually simpler than you'd expect.
Ecommerce Conversion Rate Optimization: What's Different
The principles of conversion rate optimization apply to every type of website, but ecommerce sites have specific conversion challenges that require specific solutions. Understanding these nuances is what separates a generic CRO program from one that drives real revenue for online stores.
Ecommerce conversion rate benchmarks
The average ecommerce conversion rate is typically between 1% and 4%, lower than the general 2-5% benchmark because completing a purchase carries more friction and perceived risk than a signup or form submission. Top-performing ecommerce sites consistently achieve 3-5% through strong UX, behavioral analysis, and aggressive optimization.
Break your ecommerce conversion rate (luckyorange.com/blog/posts/good-conversion-rate) down by traffic source, device type, and product category. A blended rate hides the real story. Your organic search traffic may convert at 4% while display advertising converts at 0.8% — and those require completely different optimization strategies.
The cart abandonment problem
The average cart abandonment rate in ecommerce is around 70%. Most abandoned carts aren't people who changed their mind — they're people who hit friction they weren't willing to push through: unexpected shipping costs, forced account creation, a confusing checkout flow, or a missing payment method.
Session recordings of abandoned checkout sessions are one of the highest-ROI uses of behavioral analytics in ecommerce. Watch where people stop. Watch what they click before they leave. The patterns are usually obvious once you see them — and the fixes are often quick.
Lucky Orange is the only behavioral analytics tool that supports session recordings and heatmaps on Shopify Plus's hosted checkout, giving you visibility into the most critical stage of the purchase funnel that other tools simply can't access. Merchants using Lucky Orange for Shopify can track the complete journey from first visit to completed purchase without blind spots.
Product page optimization
Your product pages carry the conversion burden for most ecommerce sites. The elements that most reliably lift product page conversion rates: high-quality images with multiple angles and zoom capability, clear pricing with no surprises, specific and credible reviews, urgency signals where genuine, and CTAs visible without scrolling.
Use heatmaps on your highest-traffic product pages to see where visitors are spending attention and what they're clicking — or not clicking. If visitors are clicking on non-interactive elements, add interactivity. If they're ignoring your CTA, it needs to move.
Case Study: Ecommerce CRO in practice — Stenbolaget
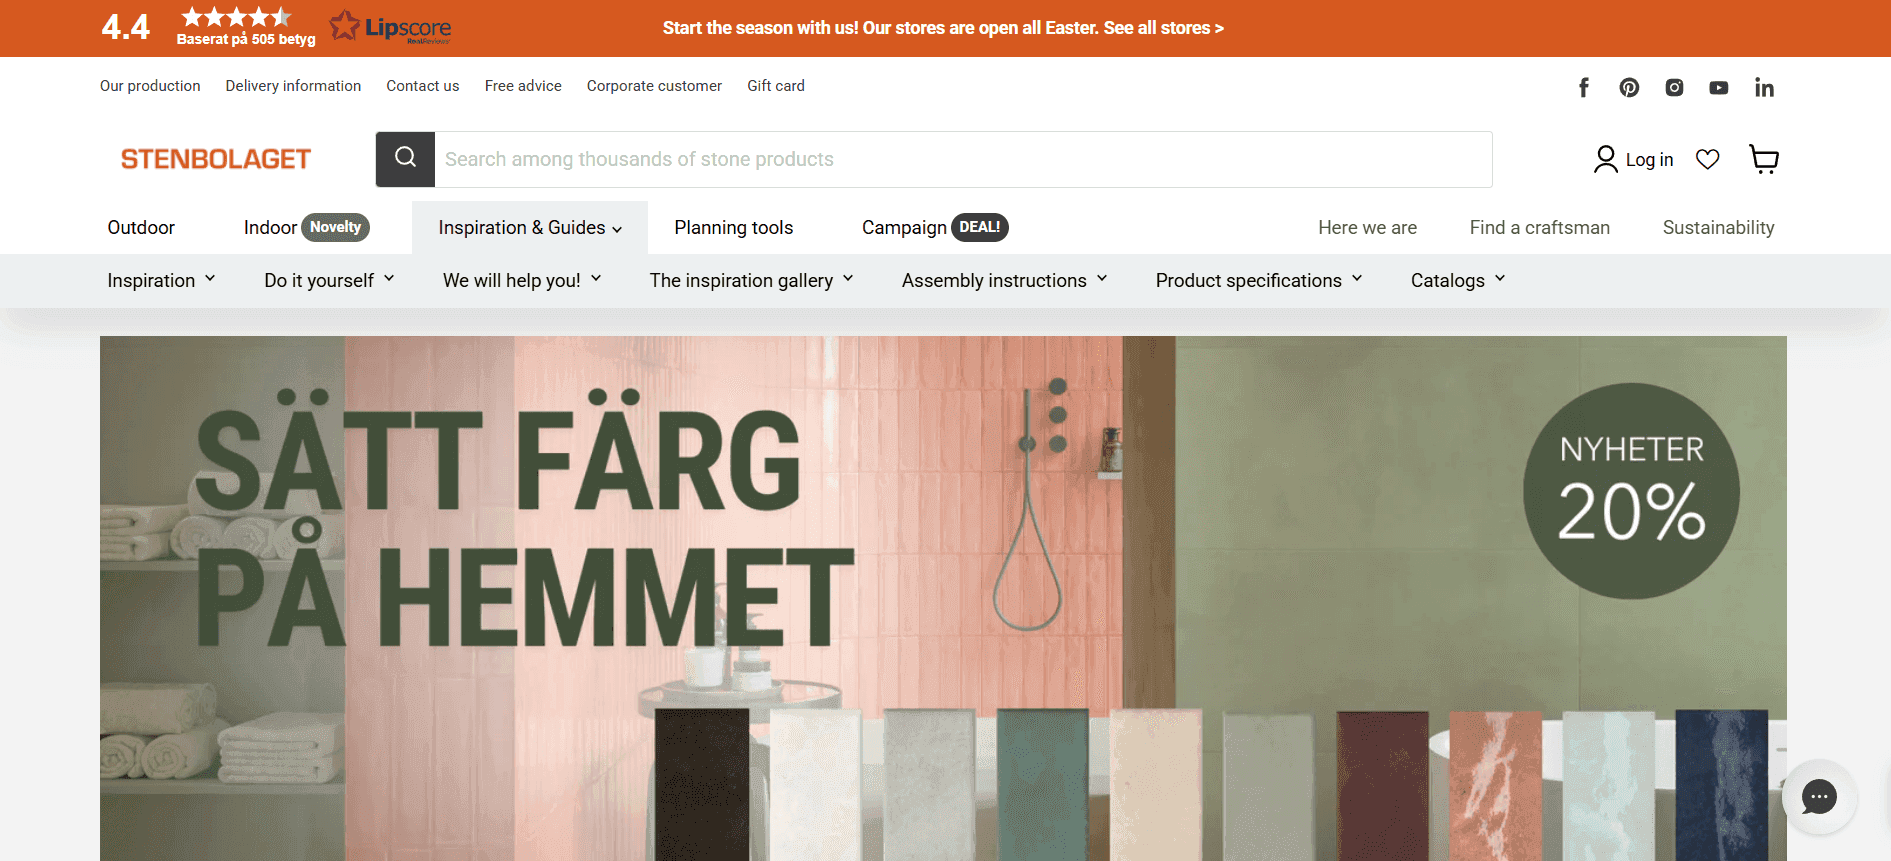
Stenbolaget, a Swedish Shopify Plus retailer selling indoor and outdoor stone, used Lucky Orange session recordings to identify friction in their online shopping experience. By watching real visitor sessions, the team identified where shoppers got confused and made targeted fixes. The result was a more streamlined path to purchase and a significant lift in conversion rates.
"Lucky Orange has become a must-have tool for us. It helps us understand what visitors need and make changes that improve their experience," said Fabian Linden, e-commerce manager.
The CRO Process: A 9-Step Framework
Successful conversion rate optimization is iterative and methodical. The teams that consistently improve their conversion rates don't rely on intuition or one-off experiments — they follow a defined CRO process that turns observations into hypotheses, hypotheses into tests, and tests into compounding wins.
Step 1: Define your conversion goals
"A conversion = completed checkout" is a useful definition. "More sales" is not. If both macro and micro conversions matter, define each one and how you'll track it. Clear goals determine which pages and user journeys deserve the most optimization attention.
Step 2: Measure your current conversion rate
Before changing anything, establish your baseline. Calculate your site's conversion rate and break it down by device, traffic source, and new vs. returning visitors. Accurate baseline measurement requires proper analytics tracking. Fix tracking before you start optimizing.
Step 3: Gather data and user feedback
With your baseline set, dig into the data to understand why visitors aren't converting. Review funnel metrics, exit rates, and bounce rates. Layer in behavioral data — heatmaps and session recordings — to see what's actually happening on your key pages. Combine with qualitative data: on-site surveys, user polls, sales team input.
Step 4: Identify key bottlenecks
Analyze your data to find the major drop-off points in your conversion funnel. Focus initial optimization efforts on the 1-3 highest-impact friction points based on how many users are affected and how severe the drop-off is. The biggest bottlenecks are often surprising — trust the data over your intuition.
Step 5: Form testable hypotheses
"If we reduce the number of checkout steps from 4 to 2, cart completion rate will increase." A good hypothesis names the change, predicts the outcome, and specifies the metric you'll use to measure success. Prioritize by potential impact and ease of implementation.
Step 6: Run your tests
Implement your hypotheses through A/B testing or multivariate testing. Show different versions to different user segments simultaneously and compare results. Let tests run long enough to collect statistically reliable data. Even a failed test is valuable — you've learned something real about your visitors.
Step 7: Implement winning changes and monitor
When a variant outperforms the control, roll it out to all users. Then keep monitoring. A change that improves conversion rates in week one can plateau or degrade as visitor mix changes. Treat implementation as a checkpoint, not a finish line. Document everything.
Step 8: Iterate and continue
CRO is never done. User expectations, device capabilities, and market conditions all change. Improve one area — the homepage, the pricing page, the checkout flow — then shift attention to the next. Even areas that were previously optimized should be retested periodically.
Step 9: Integrate CRO with your broader marketing strategy
CRO shouldn't operate in isolation. Insights from behavioral data and testing inform better ad copy, better email subject lines, better product messaging, and better customer support. Coordinate with SEO and paid acquisition — if you're driving traffic to a landing page through paid search, that page's conversion rate directly affects your return on ad spend.
CRO Tools: What You Need and Why
The right CRO tools don't just make optimization easier — they make it more accurate. A well-configured tool stack gives you visibility into what's happening on your site at every level: what visitors do, why they do it, and what happens when you change something.
Analytics layer: understand the numbers
Google Analytics 4 is the baseline for any CRO program. It shows you traffic volumes, conversion rates, funnel drop-off, traffic source performance, and cohort behavior. It's free, powerful, and essential — but it only shows you what happened, not why.
GA4's conversion funnel reports are particularly useful for identifying where visitors exit before completing your desired action. Set up conversion events for each step in your funnel and you'll see exactly where the biggest drop-offs occur.
Behavioral data layer: understand the why
This is where the real CRO leverage lives. Behavioral analytics tools show you how visitors actually interact with your site — not just aggregate metrics, but real human behavior.
Lucky Orange is the behavioral data layer that makes every other tool in your stack smarter. Heatmaps show click, scroll, and attention patterns across your key pages. Session recordings let you watch individual visitor journeys and identify friction patterns. On-site surveys capture the qualitative voice-of-customer data that behavioral data alone can't provide. And Discovery AI lets you ask natural language questions about visitor behavior — 'Why are mobile users abandoning checkout?' — and get answers grounded in real session data, without manually reviewing recordings one by one.
And while Lucky Orange is the leading option in this space there are other options available. So if you want to compare Hotjar and Crazy egg side-by-side, it's worth your time.
The distinction between Lucky Orange and traditional analytics tools is the distinction between knowing your conversion rate dropped and understanding why it dropped. Both matter. But only the latter tells you what to fix.
Testing layer: validate your hypotheses
A/B testing tools give you the infrastructure to run controlled experiments at scale — handling traffic splitting, statistical significance calculations, and variant management. Optimizely is the category standard for teams that need enterprise-grade experimentation.
The tools that test most effectively are fed by strong behavioral data. Running a test on a page element you identified through a heatmap pattern is fundamentally different from running a test based on a designer's preference. The former is optimization. The latter is organized guessing.
Other platforms like VWO offer comparable A/B testing capabilities and include some built-in behavioral features. The key principle regardless of which testing tool you choose: behavioral insights should always drive what you test, not the reverse. Lucky Orange's role in the stack is to make your testing hypotheses better — surfacing friction patterns that would take weeks to find manually and turning them into actionable tests.
Feedback layer: hear from your visitors
On-site surveys, live chat, and user interviews round out your qualitative understanding. Lucky Orange's built-in survey tools let you ask targeted questions at specific moments in the user journey without requiring a separate feedback platform.
How AI Is Changing Conversion Rate Optimization
Traditional CRO required analysts to manually sift through session recordings, segment heatmap data, and cross-reference multiple reports to form a hypothesis. It was slow, labor-intensive, and limited to whatever patterns a human could spot across a finite sample of data.
AI is compressing that workflow dramatically — and changing what's possible for teams without a dedicated CRO analyst.
From manual analysis to conversational insight
The most meaningful shift in AI-assisted CRO isn't in algorithm sophistication — it's in the interface. Natural language tools like Lucky Orange Discovery let you ask questions about your visitors' behavior the same way you'd ask a colleague: 'What are mobile users doing differently on the checkout page?' or 'Show me sessions where visitors got confused on the pricing page.'
The AI surfaces behavioral patterns across thousands of sessions, identifies anomalies, and returns specific, actionable insights — in seconds rather than hours. A hypothesis that previously required a week of manual analysis can now be formed in a single working session.
AI-generated CRO hypotheses
Beyond answering specific questions, AI can proactively surface patterns you weren't looking for. Unusual click clustering, unexpected scroll behavior, correlations between specific user actions and conversion outcomes — these are signals that manual analysis misses because no human can review every session at scale.
This matters for CRO velocity. The faster you move from observation to hypothesis to test, the more tests you can run, and the faster your conversion rate improves. Teams using AI-assisted behavioral analysis run more experiments, with better hypotheses, than teams relying on manual review.
What AI doesn't replace
AI accelerates insight generation, but it doesn't replace judgment. Which hypothesis to test first, how to frame the experiment, what constitutes a meaningful result, how to implement findings across the organization — that still requires human strategy.
AI is the analytical engine. CRO strategy is still a human discipline. The teams winning at conversion optimization in 2026 are using AI to do the analytical heavy lifting and reserving their strategic capacity for the decisions that actually require it.
CRO as a Continuous Improvement Program
Conversion rate optimization isn't a project. It's a program.
The difference matters. A project has a start date, an end date, and a deliverable. A CRO program is an ongoing operating capability — a structured way of using data to continuously improve how effectively your website converts visitors into customers.
The businesses that see the most dramatic improvements from CRO are the ones that commit to the process rather than treating it as a one-time website audit. Conversion rates compound. A 10% improvement one quarter followed by another 10% improvement the next isn't additive — it multiplies. Over 12 months of consistent optimization, those gains become transformative.
Building a testing culture
The most important thing you can do to sustain a CRO program isn't choosing the right tools — it's creating a culture where testing is normal, data overrides opinion, and failed experiments are treated as learning rather than failure.
This means sharing insights across teams, documenting wins and losses, and treating behavioral data as a shared resource. When sales, product, and support all have access to what behavioral data is revealing about the customer experience, the insights multiply.
What to measure beyond conversion rate
Track alongside your conversion rate: average order value, revenue per visitor, customer acquisition cost, bounce rate by traffic source, and user behavior metrics like scroll depth and session duration on key pages.
A change that improves conversion rate but reduces average order value might be a net negative. Look at the full picture.
The goal of conversion rate optimization, ultimately, is to help more visitors accomplish what they came to your site to do. When you remove the friction between intent and action, everyone wins — visitors get a better experience, you get better conversion performance, and your marketing budget works harder. Treat it as an ongoing commitment to understanding your users, and the results will compound in ways a single optimization sprint never could.
Frequently Asked Questions
What is conversion rate optimization (CRO)?
Conversion rate optimization is the process of improving a website or app to increase the percentage of visitors who complete a desired action — a purchase, signup, form submission, or demo request. It combines behavioral data analysis, A/B testing, and UX improvements to turn more existing traffic into customers without requiring additional ad spend.
What is a good conversion rate?
The average conversion rate across industries is 2-5%, but a good rate depends on your industry, traffic source, and the specific action you're asking visitors to take. Ecommerce transaction rates typically run 1-4%, while SaaS free trial signups can be significantly higher. The most useful benchmark is your own current rate — any consistent upward movement means your CRO efforts are working.
How do you calculate conversion rate?
Divide the number of conversions by total unique visitors, then multiply by 100. If 500 people visited your pricing page and 25 started a free trial, your conversion rate is (25 / 500) x 100 = 5%. Set up goal tracking in Google Analytics to calculate this automatically for each conversion event on your site.
How long does CRO take to show results?
Simple on-page fixes — improving a CTA, removing a form field, adding social proof — can show measurable results within days. A/B tests typically need 2-4 weeks to reach statistical significance. A structured CRO program with regular testing cycles produces compounding results over 3-6 months, with gains accelerating as you learn more about your specific audience.
What's the difference between CRO and SEO?
SEO drives more visitors to your site by improving search rankings. CRO converts the visitors you already have into customers. They're complementary — SEO fills the top of your funnel, CRO improves the efficiency of the bottom. Many CRO improvements (faster load times, better mobile UX, clearer content) also benefit SEO, creating a positive feedback loop.
What tools do you need for CRO?
A complete CRO stack includes: Google Analytics 4 (analytics and funnel measurement), Lucky Orange (behavioral analytics — heatmaps, session recordings, surveys, Discovery AI), and an A/B testing platform like Optimizely (experimentation). The behavioral data layer is where most teams underinvest — and it's where the best hypotheses come from.
What is ecommerce conversion rate optimization?
Ecommerce CRO applies conversion optimization to online stores, focusing on product page optimization, cart abandonment reduction, checkout friction, and mobile purchasing experience. The average ecommerce conversion rate is 1-4%, and top-performing stores consistently achieve 3-5% through sustained behavioral analysis and testing.
Lucky Orange


